
What is the Pareto Distribution Calculator?
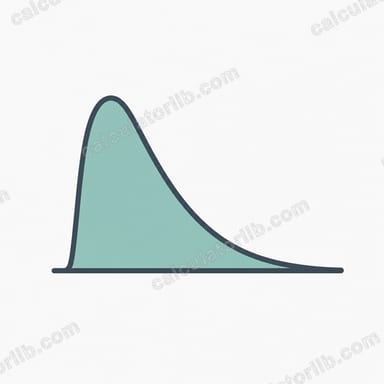
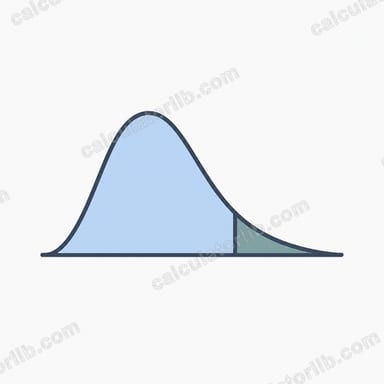
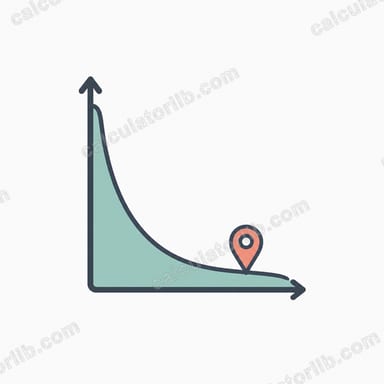
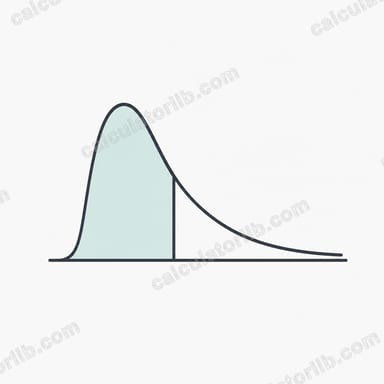
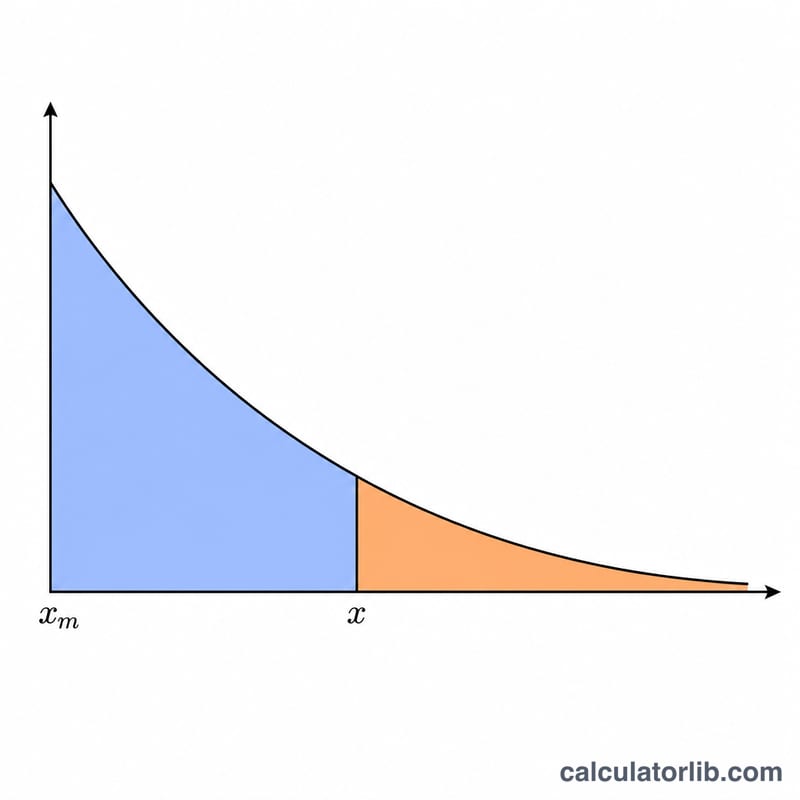
This tool evaluates the Pareto Type I distribution, a continuous probability distribution widely used to model wealth, city sizes, file sizes, and other heavy-tailed phenomena. Given a point x, a scale parameter xm, and a shape parameter alpha (the tail index), it returns the probability density (PDF), the lower (left) cumulative probability P(X less than or equal x), and the upper (right) cumulative probability P(X greater than x). It is a pure mathematics tool and is not specific to any country.
How to use it
Enter the percentile point \(x\), the scale parameter \(x_m\) (must be greater than 0), and the shape parameter \(\alpha\) (must be greater than 0). The calculator returns three values. The lower and upper cumulative probabilities always add to 1, which is a handy sanity check.
The formula explained
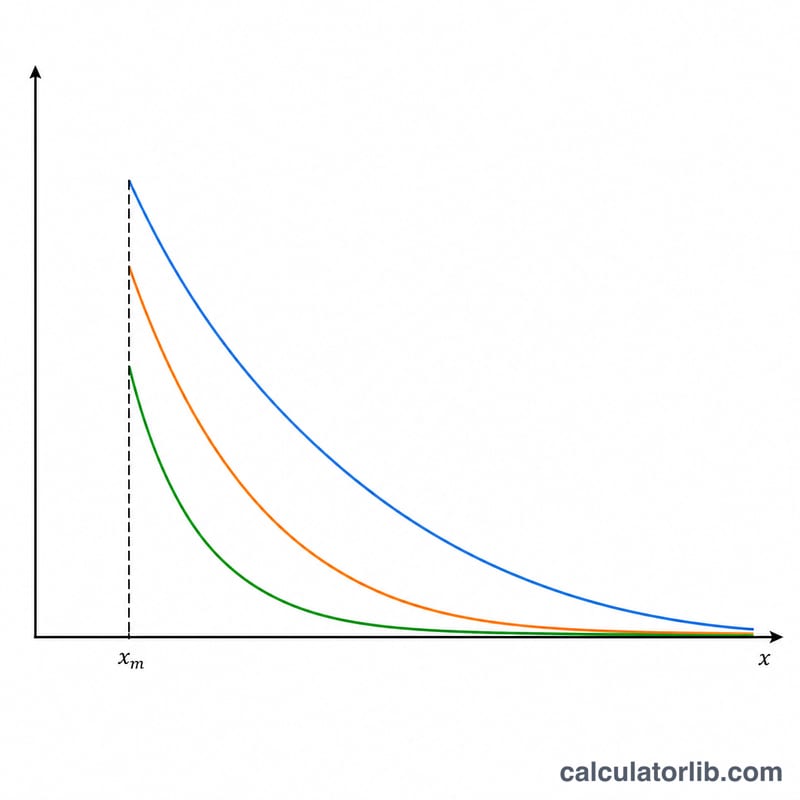
The Pareto distribution has support \(x \ge x_m\). For \(x \ge x_m\) the density is $$f(x) = \frac{\alpha\;x_m^{\alpha}}{x^{\alpha+1}}$$ the CDF is $$F(x) = 1 - \left(\frac{x_m}{x}\right)^{\alpha}$$ and the survival function is $$Q(x) = \left(\frac{x_m}{x}\right)^{\alpha}$$ For \(x\) below \(x_m\) the variable is outside its support, so \(f(x) = 0\), \(F(x) = 0\), and \(Q(x) = 1\). A larger \(\alpha\) means a lighter tail and faster-decaying probability of large values.
Worked example
Take \(x = 2\), \(x_m = 1\), \(\alpha = 1\). Since 2 is at least 1, use the active branch. The ratio \(x_m/x = 0.5\). Then $$f(2) = \frac{1 \cdot 1}{2^2} = 0.25$$ $$F(2) = 1 - 0.5 = 0.5$$ and \(Q(2) = 0.5\). Check: \(0.5 + 0.5 = 1.0\).
FAQ
What does the shape parameter alpha mean? It is the tail index: smaller \(\alpha\) gives a heavier tail (more extreme large values), larger \(\alpha\) gives a lighter tail.
Why is the density 0 below xm? The Pareto Type I distribution is only defined for \(x \ge x_m\); the scale parameter is the minimum possible value of the variable.
Does the distribution have a finite mean? The mean exists only when \(\alpha\) is greater than 1; the variance exists only when \(\alpha\) is greater than 2.