
What is the Generalized Pareto Distribution?
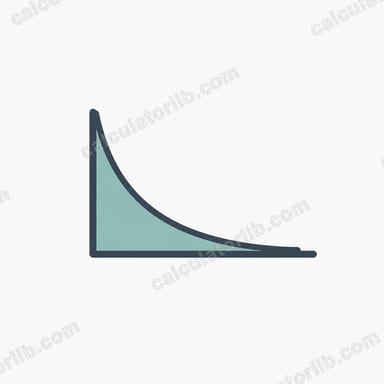
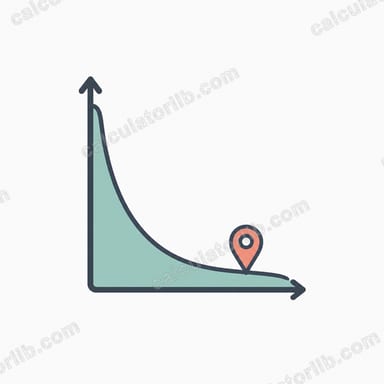
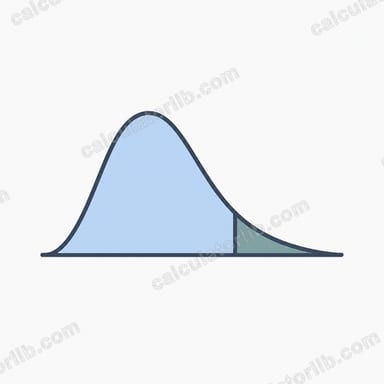
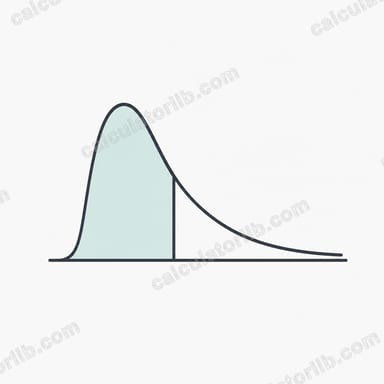
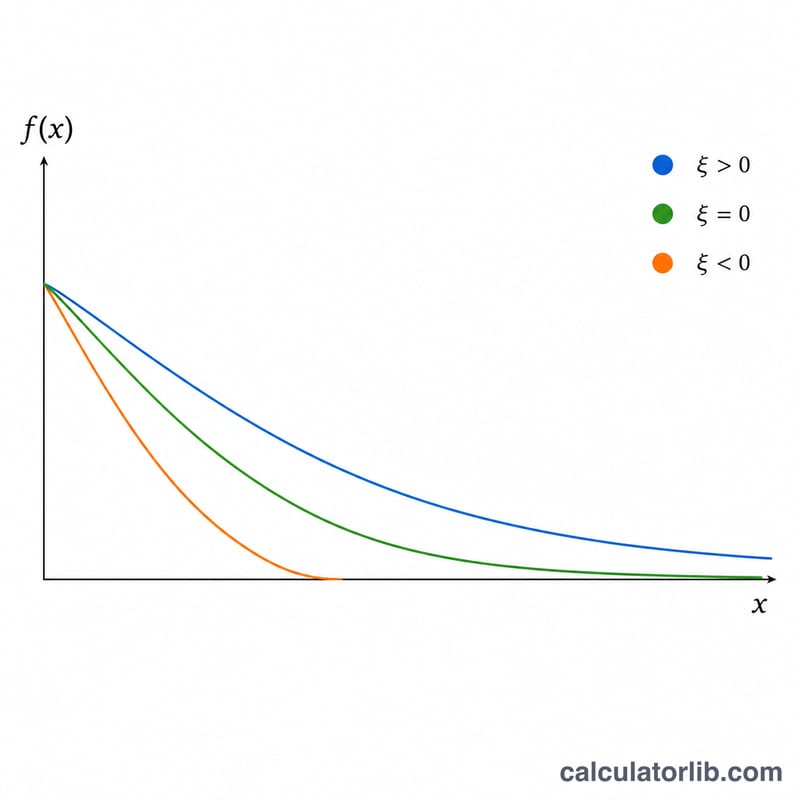
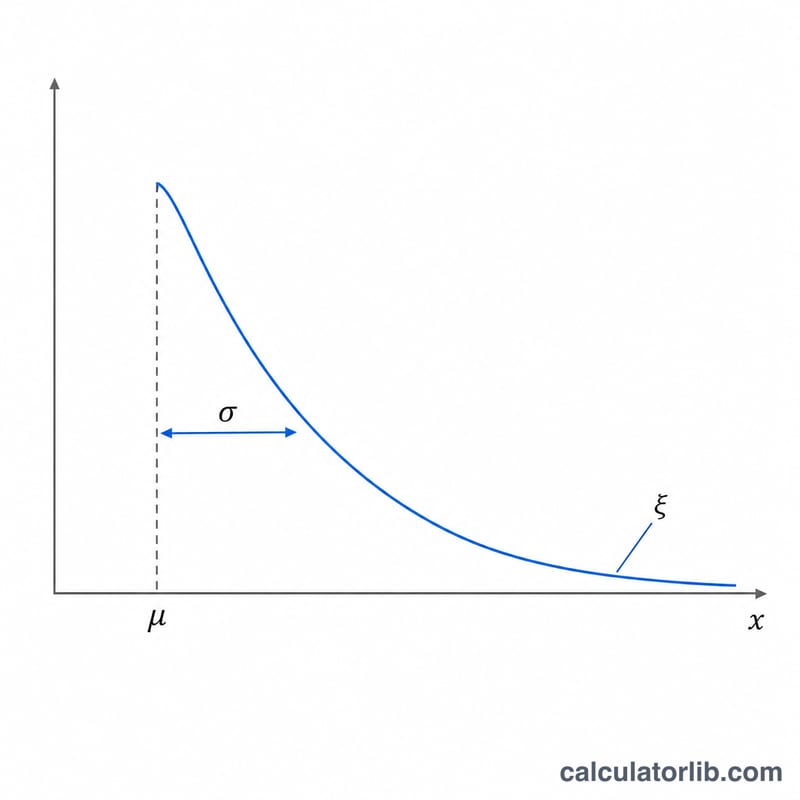
The Generalized Pareto Distribution (GPD) is a continuous probability distribution widely used in extreme value theory to model the tails of distributions, exceedances over a threshold, and heavy-tailed phenomena in finance, hydrology, and reliability engineering. It is described by three parameters: a location parameter mu, a scale parameter sigma (which must be positive), and a shape parameter xi that controls the heaviness of the tail. This is a pure mathematical tool with no regional or jurisdictional scope.
How to use this calculator
Choose the function you want: the probability density (PDF), the lower cumulative distribution (CDF), or the upper cumulative survival function. Enter the three parameters mu, sigma and xi. Then define the x sequence with an initial value, a step increment, and the number of points to evaluate. The calculator produces a table of (x, y) pairs and a line graph, plus the single function value at the first x for quick reference.
The formula explained
Let \(B = 1 + \xi\,\frac{x - \mu}{\sigma}\). When \(\xi\) is not zero, the density is $$f(x) = \frac{1}{\sigma}\,B^{-\frac{1}{\xi} - 1},$$ the CDF is $$P(x) = 1 - B^{-\frac{1}{\xi}},$$ and the survival function is $$Q(x) = B^{-\frac{1}{\xi}} = 1 - P.$$ When \(\xi\) equals zero, the distribution degenerates to the exponential form: $$f(x) = \frac{1}{\sigma}\,e^{-\frac{x-\mu}{\sigma}} \quad\text{and}\quad P(x) = 1 - e^{-\frac{x-\mu}{\sigma}}.$$ The support is \(x \ge \mu\) when \(\xi \ge 0\), and \(\mu \le x \le \mu - \frac{\sigma}{\xi}\) when \(\xi < 0\). Outside the support the density is 0, while \(P\) and \(Q\) clamp to their boundary values.
Worked example
Take the CDF with \(\mu = 1\), \(\sigma = 1\), \(\xi = 1\) at \(x = 2\). Then $$B = 1 + 1\cdot\frac{2-1}{1} = 2,$$ so $$P = 1 - 2^{-1} = 0.5.$$ The PDF at the same point is $$2^{-2} = 0.25,$$ and the survival function is $$Q = 2^{-1} = 0.5,$$ confirming \(P + Q = 1\).
FAQ
Why must sigma be positive? Sigma is a scale parameter that divides several terms; a non-positive value is mathematically undefined, so the tool guards against it.
What happens when xi = 0? The GPD becomes the exponential distribution. The calculator automatically switches to the exponential formulas when \(|\xi|\) is below a tiny epsilon to avoid dividing by zero.
Can I scan x downward? Yes. Use a negative step increment to evaluate x values in descending order.