
What is the Poisson Distribution Calculator?
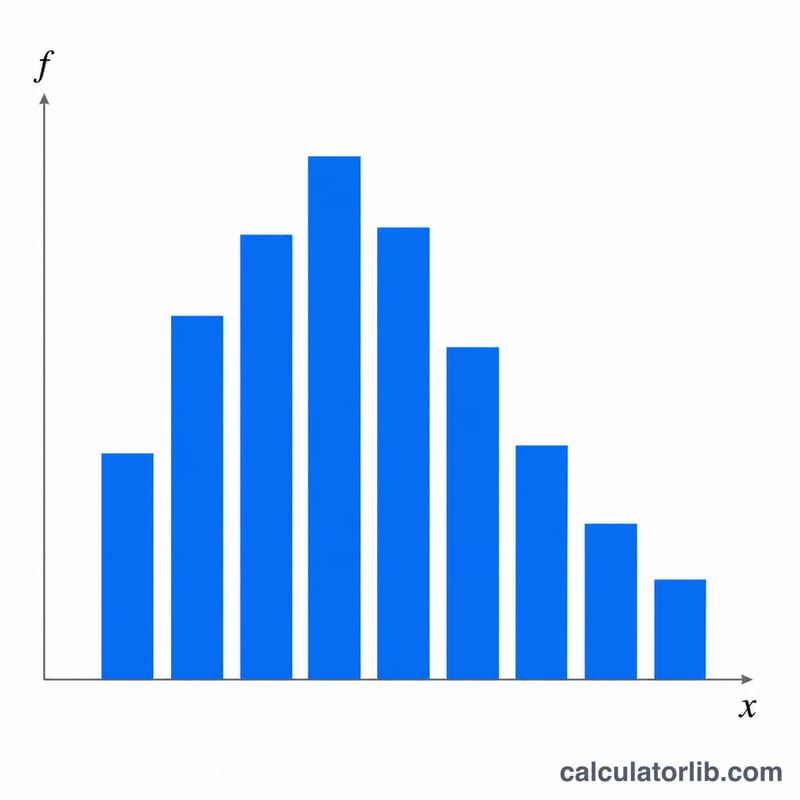
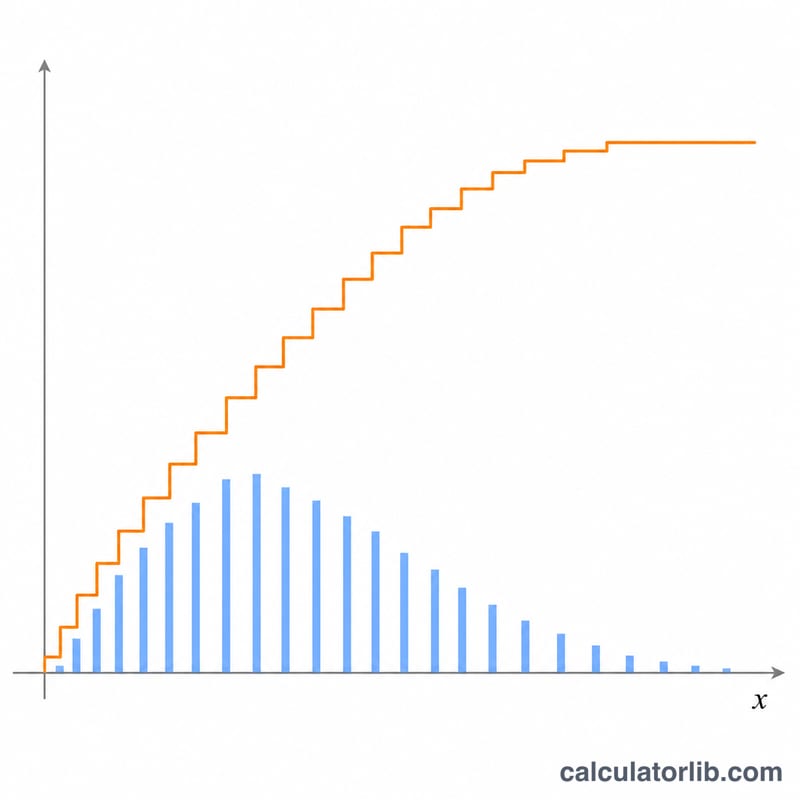
The Poisson distribution models the number of events that occur in a fixed interval of time or space, given a known constant average rate (the mean) and the assumption that events happen independently. This calculator tabulates three quantities over a sequence of x values: the probability mass \(f(x;\lambda)\), the lower cumulative probability \(P(x;\lambda) = P(X \le x)\), and the upper cumulative probability \(Q(x;\lambda) = P(X \ge x)\).
How to use it
Choose which series to highlight (probability mass f, lower cumulative P, or upper cumulative Q). Enter the mean value \(\lambda\) (must be \(\ge 0\)), the initial value of x, the increment (step), and the number of repetitions (rows). The calculator generates \(x = \text{initialX},\ \text{initialX}+\text{step},\ \text{initialX}+2\cdot\text{step},\ \ldots\) and shows f, P and Q for each, highlighting the selected column.
The formula explained
The probability mass function is $$f(x;\lambda) = e^{-\lambda} \cdot \frac{\lambda^{x}}{x!}.$$ The lower cumulative distribution sums all masses up to x: $$P(x;\lambda) = \sum_{t=0}^{x} f(t;\lambda).$$ The upper cumulative probability includes the term at x itself: $$Q(x;\lambda) = 1 - P(x;\lambda) + f(x;\lambda),$$ so P and Q overlap on \(f(x)\). For numerical stability we compute f using log factorials: $$f = \exp\!\left(-\lambda + x\cdot\ln\lambda - \ln(x!)\right).$$
Worked example
With \(\lambda = 5\) and \(x = 0\): \(e^{-5} = 0.006737947\), so \(f(0) = 0.006737947\), \(P(0) = 0.006737947\), and $$Q(0) = 1 - 0.006737947 + 0.006737947 = 1.$$ At \(x = 5\), \(f(5) = 0.175467\), \(P(5) = 0.615961\), and \(Q(5) = 0.559507\) — meaning about 61.6% of the probability mass sits at \(X \le 5\).
FAQ
Why does P + Q exceed 1? Because both the lower cumulative P (\(X \le x\)) and upper cumulative Q (\(X \ge x\)) include the point mass \(f(x)\); their sum is \(1 + f(x)\).
What happens when \(\lambda = 0\)? All mass is at \(x = 0\): \(f(0) = 1\), \(f(x) = 0\) for \(x > 0\), and \(P(x) = 1\) for every \(x \ge 0\).
Can \(\lambda\) be non-integer? Yes — \(\lambda\) is a rate and may be any value \(\ge 0\); x values are non-negative integers.


