
What this calculator tells you
It answers one question: if you keep saving until you retire, how much can you take out every month afterwards without running out of money by your life expectancy? It grows what you have today plus everything you still plan to add, then converts that pot into a level monthly paycheque over the years you expect to spend retired — once as a fixed dollar amount, and once as an amount that rises with inflation so your spending power stays flat.
This is the calculation you need when you are close enough to retirement that "am I saving enough?" has turned into "what will this actually pay me?" — deciding a retirement date, sizing a pension against a savings pot, or sanity-checking a 4% rule of thumb against your own numbers.
The eight inputs
Every field is a plain number. Percentages go in as percentages (6, not 0.06). Amounts may be typed with commas.
| Input | Where the value comes from | Sensible range |
|---|---|---|
| Current age | You. Fractions are allowed and get rounded to a whole year. | 0–150 |
| Age of retirement | Your target date. May equal your current age. | Current age or later |
| Life expectancy | How long the money must last, not an average. Actuarial tables put a healthy 65-year-old near 85–90; planning to 90–95 buys margin. | Strictly above retirement age |
| Current retirement savings | Today's balance across 401(k), IRA and taxable accounts. Negative values are accepted. | Any |
| Future annual savings | Lump contributions made once a year — a bonus, a profit share. Leave at 0 if you save monthly. | 0 and up |
| Future monthly savings | Payroll deferrals plus employer match, per month. | 0 and up |
| Average investment return | Long-run nominal return on your mix. A 60/40 portfolio is commonly modelled at 5–7%. | Above −100%; 4–8% typical |
| Inflation rate | Long-run price growth. 2–3% is the usual planning assumption. | 0–5% typical |
Both age comparisons are checked before rounding, and every age must sit in 0–150. If any single field is not a clean number — a currency sign, a percent sign, a stray letter — you get no result at all rather than an error message.
The formula
Write \(P\) = current savings, \(A\) = annual savings, \(M\) = monthly savings, \(r\) = return rate as a decimal, \(f\) = inflation as a decimal, \(n\) = whole years until retirement, \(m\) = whole years in retirement.
Saving compounds once a year. Your twelve monthly deposits are first collapsed into one end-of-year figure by growing each at the true monthly equivalent of \(r\), namely \(i_m = (1+r)^{1/12}-1\):
$$M_{eq} = M\cdot\frac{r}{(1+r)^{1/12}-1}$$ $$B = P(1+r)^{n} + (A + M_{eq})\cdot\frac{(1+r)^{n}-1}{r}$$That balance then funds \(12m\) end-of-month withdrawals. The monthly payout factor at an annual effective rate \(i\) is
$$W(i) = B\cdot\frac{(1+i)^{1/12}-1}{1-(1+i)^{-m}}$$The fixed-dollar withdrawal uses \(i = r\). The inflation-adjusted withdrawal uses the real rate \(r_r = (R-F)/100\) — the two percentages simply subtracted. Any figure shown "in today's money" is divided by \((1+f)^{k}\), where \(k = n\) for amounts dated at retirement and \(k = n+m\) for the amount dated at life expectancy.
Worked example
Age 35, retiring at 67, life expectancy 85. Savings today $30,000, no annual contribution, $500 a month, 6% return, 3% inflation. So \(n = 32\), \(m = 18\), \(r = 0.06\), \(f = 0.03\).
$$i_m = 1.06^{1/12}-1 = 0.00486755 \quad\Rightarrow\quad M_{eq} = 500\times\frac{0.06}{0.00486755} = 6{,}163.26$$ $$B = 30{,}000\times 1.06^{32} + 6{,}163.26\times\frac{1.06^{32}-1}{0.06} = 193{,}601.60 + 560{,}177.71 = \$753{,}779$$Now the two withdrawals, both over \(12\times 18 = 216\) months:
$$W(0.06) = 753{,}779\times\frac{1.06^{1/12}-1}{1-1.06^{-18}} = 753{,}779 \times 0.0074925 = \$5{,}648$$ $$W(0.03) = 753{,}779\times\frac{1.03^{1/12}-1}{1-1.03^{-18}} = 753{,}779 \times 0.0059773 = \$4{,}506$$And in today's money, with \(1.03^{32} = 2.5751\) and \(1.03^{50} = 4.3839\):
$$\frac{753{,}779}{2.5751} = \$292{,}720 \qquad \frac{5{,}648}{2.5751} = \$2{,}193 \qquad \frac{5{,}648}{4.3839} = \$1{,}288$$So: a pot of $753,779, worth $292,720 in today's money. Either draw a level $5,648 a month — which buys what $2,193 buys today on day one and only $1,288 by age 85 — or start at $4,506 and raise it 3% every year, holding purchasing power at a steady $1,750 of today's money throughout.
Rules that surprise people
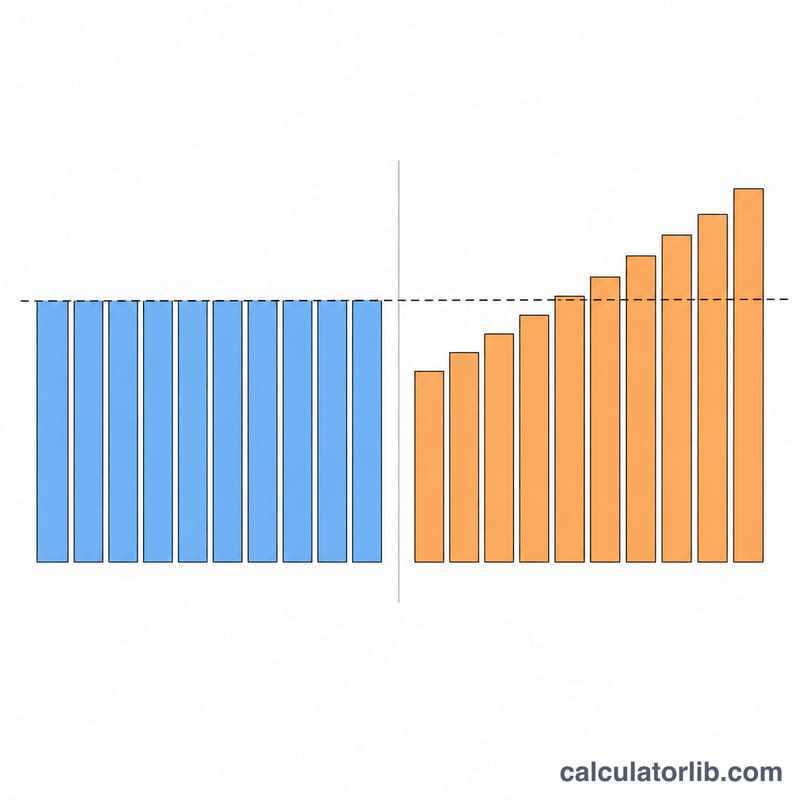
Monthly saving is worth more than twelve times the monthly amount. $500 a month is not treated as $6,000 dropped in at year end; it is treated as twelve deposits spread through the year, each earning part of a year's growth. At 6% the multiplier is 12.33, not 12. That is why $500/month alone grows to $560,178 while $6,000/year alone reaches only $545,339 — a $14,839 gap on identical cash.
Contributions land at the end of each period, never today. There is no deposit at time zero, so setting your retirement age equal to your current age drops your contributions entirely: the balance is exactly your current savings, not one year's saving on top. The headline balance always includes your existing savings — on the defaults, $193,602 of the $753,779 is just today's $30,000 compounding.
The real rate is a subtraction, not a ratio. A 6% return against 3% inflation is treated as a 3.000% real rate, not the textbook 1.06/1.03 − 1 = 2.913%. That is worth about $32 a month here — the inflation-adjusted figure reads $4,506 rather than $4,474.
Ages are rounded, but only after the ordering is checked. Half a year rounds up. Entering 35.6 and 36.4 is accepted — and since both round to 36, you get zero years of saving and a balance of exactly $30,000. Entering 35.6 and 35.4 is refused outright even though both round to 36. When a fraction crosses the halfway mark it also moves the whole answer: ages 35.5 / 67.4 / 85.75 round to 36 / 67 / 86, giving 31 years of saving and 19 of retirement — a balance of $705,298 and withdrawals of $5,128 and $4,048, all well below the baseline.
Setting inflation to exactly 0 removes five of the seven lines. You get the balance and one withdrawal figure, nothing else — no "today's money" lines and no fixed-purchasing-power section. Enter 0.000001 instead and the full report comes back with numbers that are identical to seven digits. If you want the whole layout with a negligible inflation assumption, use a tiny non-zero number.
Extreme assumptions delete sections rather than showing nonsense. If inflation exceeds the return by more than 100 percentage points, the fixed-purchasing-power block disappears; exactly 100 points apart still shows it, printing $0. A return of −100% or worse produces no result at all.
The two "today's money" lines under the fixed amount are the same withdrawal, dated differently. $2,193 and $1,288 are both $5,648 — one deflated to your retirement date, one to your life expectancy. That 41% drop over 18 years is the real cost of a level nominal payment, and it is the strongest argument for reading the $4,506 line instead.
Questions people ask
Why is the inflation-adjusted withdrawal smaller than the fixed one?
Because it starts smaller and grows. $4,506 rising 3% a year passes $5,648 around year eight and ends near $7,400, while the fixed $5,648 never moves. Over the full 18 years the two schedules cost the pot the same.
Does this account for Social Security, pensions or taxes?
No. Every figure is pre-tax and covers only the savings you enter. Guaranteed income streams should be added separately, and withdrawals from a traditional 401(k) or IRA are taxable as ordinary income — the amounts shown are what leaves the account, not what reaches your bank.
What return and inflation should I use?
Use long-run averages, not this year's. A diversified stock-and-bond mix is usually modelled at 5–7% nominal and inflation at 2–3%. Small changes compound hard: on the example above, assuming 7% instead of 6% lifts the fixed monthly withdrawal from $5,648 to $7,578.
Can I enter a negative return, or negative savings?
Yes to both. Negative returns compute normally as long as they stay above −100%, and a negative current balance (debt against the plan) is accepted and produces negative withdrawals.
The pot hits zero exactly at my life expectancy — is that safe?
It is the assumption, not a recommendation. The calculation spends the balance down to nothing on schedule, so outliving the age you entered means outliving the money. Planning to 90–95 rather than 85, or treating the result as a ceiling rather than a target, is the usual correction.
Interpreting Your Result
The calculator returns two different monthly incomes from the same projected pot, plus a "today's money" version of each. They are not alternatives in the sense that one is better — they are two different shapes for spending the identical balance.
Level (fixed) versus inflation-indexed
- Level monthly withdrawal — the same dollar amount every month from your retirement age until your stated life expectancy. It is the annuity payment on the projected balance at the nominal monthly return \(i=(1+R)^{1/12}-1\).
- Inflation-indexed withdrawal — a smaller first payment that is increased every year by the inflation rate you entered, so its purchasing power stays constant. It is computed with the real monthly rate \(r=\left(\dfrac{1+R}{1+f}\right)^{1/12}-1\), which is why it starts lower.
Both plans exhaust exactly the same balance over exactly the same number of months. The level plan front-loads real spending; the indexed plan back-loads it. With a 25-year retirement and 2.5% inflation, a level payment buys only \(1/1.025^{25}\approx 54\%\) as much in the final year as in the first — roughly half. That is the single most important thing the two numbers are telling you.
What "in today's money" means
Every projected figure is also divided by the cumulative inflation factor between now and the date it occurs:
$$\text{Real value}=\frac{\text{Nominal amount}}{(1+f)^{n}}$$So a pot of $1,534,600 in 25 years at 2.5% inflation is worth about $827,800 in the prices you pay today, and a $9,739 level monthly payment is worth about $5,253 of today's spending power at the moment it starts — and less every year after that. Real figures let you compare the output against your current grocery bill and rent instead of against an unfamiliar future price level.
What this result is — and is not
- It is deterministic. One fixed return, one fixed inflation rate, applied every single month. Real markets do not deliver 6% every year; they deliver −18% and +24% in some order. This is an arithmetic annuity schedule, not a simulation.
- It is not a probability of success. Monte Carlo tools report something like "this plan survived 87% of simulated histories." This calculator reports no probability at all. There is no confidence level attached to the number.
- It ends at zero. By construction the balance is exactly $0 in the month you reach the life expectancy you entered. Nothing is left for a bequest, long-term care, or a single large late-life expense unless you plan for it separately.
- Outliving the horizon leaves nothing. Life expectancy is a midpoint, not a deadline — roughly half of people who reach a given age live beyond the average for that age. If you enter 90 and live to 96, the schedule has no money for those six years. Many planners therefore enter a horizon well past average life expectancy, or test 95 and 100 as separate runs.
- It ignores taxes and fees. Withdrawals from pre-tax retirement accounts are generally taxable income, and fund/platform fees reduce the return you actually earn. A 0.75% total fee drag on a 6% assumption is really a 5.25% assumption. Neither is modelled here.
- It ignores other income. State pension income — Social Security in the United States, the State Pension in the UK, and equivalent schemes elsewhere — plus workplace defined-benefit pensions and annuities are not included. The monthly figure is what your invested savings alone can pay.
- It ignores sequence-of-returns risk. Two retirements with the same average return but different order of returns end very differently. A large loss in the first few years of drawdown, while withdrawals are still being taken, does permanent damage that a later loss of the same size does not.
Cross-check against the 4% rule
A quick sanity check on any drawdown figure is the well-known 4% guideline: take 4% of the pot in year one, then raise that dollar amount with inflation. As a monthly number that is simply
$$\text{Monthly}\approx\frac{\text{Pot}\times 0.04}{12}$$For the baseline pot of $1,534,600 that is about $5,115 per month. The calculator's indexed first payment of about $7,570 (an initial rate near 5.9% of the pot) and its level payment of about $9,739 (about 7.6%) are both higher — as they should be, because this tool deliberately spends the account down to zero over a defined horizon, while the 4% guideline is a conservative rule intended to survive bad market sequences with a balance still standing. If your indexed figure comes out far above the 4% line, that is a signal that your return assumption is optimistic, your horizon is short, or both. Note that the 4% rule originates in studies of United States stock and bond returns over the 20th century (Bengen, and the Trinity study) and does not automatically transfer to other markets, currencies, or tax systems.
This section explains what the numbers mean; it is general information, not personal financial advice. Consider discussing your own plan with a qualified adviser who knows your tax situation and country.
Key Terms and Variables Defined
Symbols used in the formula
| Symbol | Name | Meaning |
|---|---|---|
| \(P\) | Current savings | The balance you already hold in invested retirement savings today (field: currentSavings). It compounds for the whole accumulation period. |
| \(A\) | Annual contribution | A lump sum you add once a year — a bonus, a profit share, or a yearly top-up (field: annualContribution). |
| \(M\) | Monthly contribution | The regular amount added every month, including anything your employer pays in on your behalf (field: monthlyContribution). |
| \(R\) | Nominal annual return | The average yearly growth rate you assume before inflation is removed (field: annualReturnRatePct). The monthly equivalent is \(i=(1+R)^{1/12}-1\). |
| \(f\) | Inflation rate | The assumed average annual rise in prices (field: inflationRatePct). Used both to index withdrawals and to restate every figure in today's money. |
| \(n\) | Accumulation years | Retirement age minus current age — the years left to save and compound. |
| \(m\) | Retirement months | \(m=12\times(\text{life expectancy}-\text{retirement age})\) — the number of monthly payments the pot must fund. |
| \(r\) | Real monthly rate | \(r=\left(\dfrac{1+R}{1+f}\right)^{1/12}-1\) — the monthly growth rate after inflation, used for the indexed withdrawal. |
| FV | Future value | The projected balance on the day you retire, before any withdrawal is taken. |
| \(W\) | Monthly withdrawal | The payment that reduces FV to exactly zero after \(m\) months. |
Concepts
- Accumulation phase
- The working years, from your current age to your retirement age, when contributions go in and nothing comes out.
- Decumulation (drawdown) phase
- The retirement years, when no contributions are made and the balance is spent down while the remainder keeps earning a return.
- Nominal return
- Growth measured in raw currency units, before adjusting for rising prices. A 6% nominal return means the account balance is 6% larger in dollars.
- Real (inflation-adjusted) return
- Growth in purchasing power. It is not simply \(R-f\); exactly, \(\text{real}=\dfrac{1+R}{1+f}-1\). With 6% nominal and 2.5% inflation the real return is 3.41%, not 3.5%.
- Today's money / purchasing power
- A future amount divided by \((1+f)^{n}\), so it can be compared with what things cost now. $100,000 in 25 years at 2.5% inflation is about $53,900 of today's purchasing power.
- Compounding
- Earning a return on returns already earned. It is why the accumulation figure grows far faster than the total amount you contributed, and why an extra few years before retiring has an outsized effect.
- Future value vs present value
- Future value moves money forward in time at a growth rate; present value moves it backward at a discount rate. This tool does both — forward at the return rate to get the pot, backward at the inflation rate to express it in today's money.
- Life expectancy (planning horizon)
- Here it is a planning end-date, not a prediction. Population life expectancy at birth is lower than life expectancy conditional on already having reached 65, and about half of people exceed the average for their age. Choosing a longer horizon lowers the monthly figure but reduces the risk of running out.
- Level withdrawal
- A fixed currency amount each month for the whole horizon. Simple, but its real value falls year after year.
- Indexed withdrawal
- A payment raised each year by the inflation rate, so real spending stays flat. It must start lower than the level payment to fund the same total.
- Employer match
- Money your employer adds to your workplace plan, typically as a percentage of pay conditional on your own contribution. If you receive one, include it in the monthly contribution figure — it is part of what compounds.
- 401(k) / IRA / taxable account
- Account types specific to the United States: a 401(k) is an employer-sponsored plan, an IRA an individual retirement arrangement (both usually tax-deferred, with taxable withdrawals in retirement, or Roth versions funded with after-tax money), and a taxable brokerage account has no special treatment. Other countries have their own wrappers — ISAs and SIPPs in the UK, RRSPs and TFSAs in Canada, superannuation in Australia. This calculator is wrapper-agnostic: it models one pooled balance and applies no tax rules of any country.
- The 4% rule
- A guideline from studies of historical US market returns: withdraw 4% of the starting balance in the first year of retirement, then increase that amount with inflation. It is a rule of thumb for a roughly 30-year retirement, not a law, and it assumes a diversified stock/bond portfolio.
How the Monthly Withdrawal Changes Across Scenarios
Every row below starts from one common baseline and changes exactly one input, so the difference in the last three columns is attributable to that single lever.
Baseline: age 40 today, $200,000 already saved, $1,000 per month contributed (no annual lump sum), 6% nominal return, 2.5% inflation, retire at 65, plan to age 90 (300 monthly payments). Figures are rounded; currency shown in dollars but the arithmetic is currency-neutral.
| Scenario | Pot at retirement (nominal) | Fixed monthly withdrawal | Indexed 1st-year monthly | Fixed amount in today's money |
|---|---|---|---|---|
| Baseline (retire 65, to 90, 6%, 2.5%, $1,000/mo) | $1,534,600 | $9,739 | $7,570 | $5,253 |
| Retire at 62 (28 years of drawdown) | $1,255,500 | $7,598 | $5,772 | $4,413 |
| Retire at 67 (23 years of drawdown) | $1,749,700 | $11,537 | $9,112 | $5,923 |
| Life expectancy 85 (240 payments) | $1,534,600 | $10,854 | $8,792 | $5,855 |
| Life expectancy 95 (360 payments) | $1,534,600 | $9,044 | $6,774 | $4,879 |
| Return 4% | $1,042,000 | $5,459 | $4,145 | $2,945 |
| Return 7% | $1,868,500 | $12,951 | $10,179 | $6,986 |
| Inflation 2% | $1,534,600 | $9,739 | $7,976 | $5,936 |
| Inflation 4% | $1,534,600 | $9,739 | $6,428 | $3,653 |
| Save $500/month | $1,196,500 | $7,593 | $5,902 | $4,096 |
| Save $1,500/month | $1,872,700 | $11,884 | $9,238 | $6,411 |
Which lever moves the answer most
- The return assumption dominates the nominal figure. Moving from 6% to 4% cuts the level payment by 44% ($9,739 → $5,459); moving to 7% raises it by 33%. Over 25 years of compounding, one percentage point of return is worth far more than one percentage point of contribution. It is also the input you control least — which is a reason to test a pessimistic value rather than a hopeful one.
- Inflation is invisible in the nominal column and brutal in the real one. The fixed payment is identical ($9,739) at 2%, 2.5% and 4% inflation, because inflation plays no part in the accumulation return or the nominal annuity. But in today's money that same payment is worth $5,936, $5,253 or $3,653 — a 38% swing. Judge inflation changes only by the last column and the indexed column.
- Retirement age is a double lever. Retiring at 67 rather than 62 adds five years of contributions and compounding and removes five years of payments, so the level withdrawal rises 52% ($7,598 → $11,537). No other single-year decision is worth as much per year.
- Contributions scale close to linearly, but only on the new money. Tripling the monthly contribution from $500 to $1,500 raises the pot by 57%, not 200%, because the existing $200,000 grows to $858,400 regardless of what you add.
- Horizon length matters less than people expect. Extending the plan from 85 to 95 — ten extra years, a 50% longer retirement — reduces the level payment by only 17% ($10,854 → $9,044), because the untouched balance keeps earning. Planning for a longer life is cheaper than it looks.
These scenarios are illustrative arithmetic under fixed-rate assumptions and are general information, not financial advice for your situation.