
What Is a Take-Home Paycheck Calculator?
A take-home paycheck calculator estimates the money you actually receive in each paycheck after taxes and deductions are subtracted from your gross pay. While your gross pay is the headline figure on your job offer, your net pay is what lands in your bank account — and the gap between the two can be significant once income tax, pre-tax benefits, and post-tax withholdings are applied.
How to Use It
Enter your gross pay for a single pay period (weekly, biweekly, or monthly — just be consistent). Add your effective total tax rate as a percentage; this can combine federal, state, and payroll taxes into one blended figure. Then enter any pre-tax deductions (such as retirement contributions or health insurance premiums that lower taxable income) and post-tax deductions (such as Roth contributions or union dues). The calculator returns your net pay, estimated tax, total deductions, and the percentage of gross you keep.
The Formula Explained
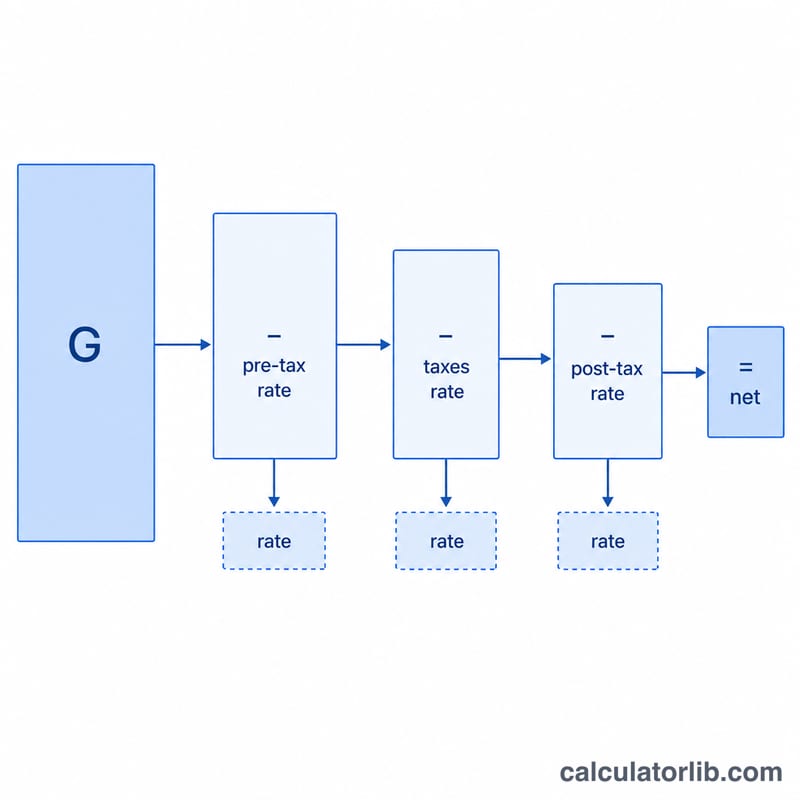
The calculator first reduces gross pay by pre-tax deductions to find the taxable base, applies the tax rate to that base, then subtracts all deductions:
$$\text{Net} = \text{Gross} - (\text{Gross} - \text{PreTax}) \times \text{rate} - \text{PreTax} - \text{PostTax}$$
Treating pre-tax deductions as tax-exempt mirrors how real payroll works and gives a more accurate result than taxing the full gross.
Worked Example
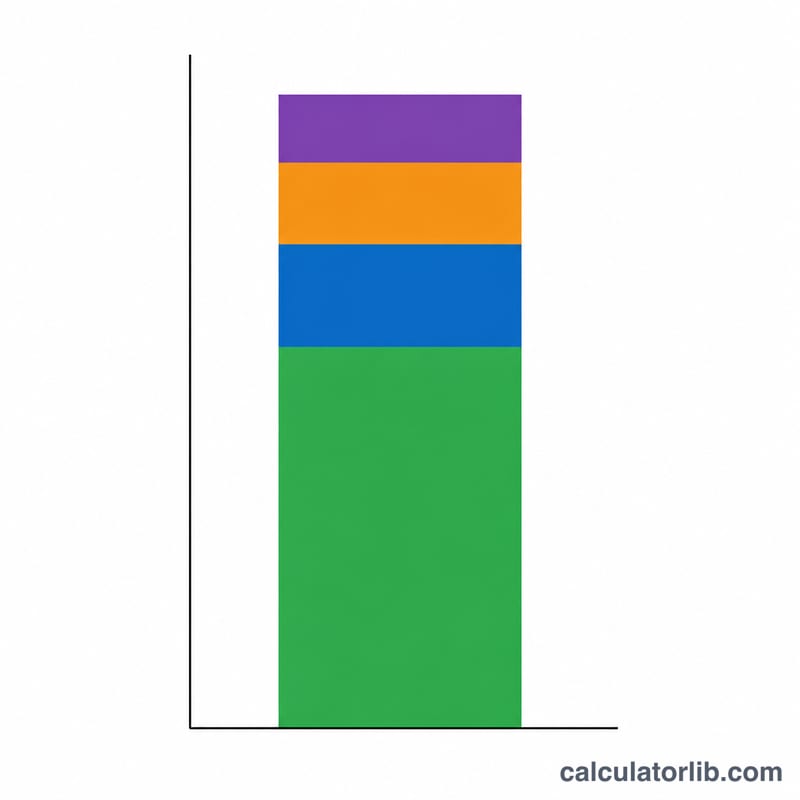
Suppose your gross pay is $5,000, your blended tax rate is 22%, you contribute $500 pre-tax, and you have $100 in post-tax deductions. Taxable base \(= \$5{,}000 - \$500 = \$4{,}500\). Tax \(= \$4{,}500 \times 0.22 = \$990\). Net pay $$\$5{,}000 - \$990 - \$500 - \$100 = \$3{,}410,$$ which is 68.2% of gross.
Paycheck Terms and Deductions Defined
The terms below are used by this calculator. Tax details such as FICA refer to the United States; other countries use different systems.
- Gross pay: Total earnings for a pay period before any taxes or deductions are removed (wages, overtime, bonuses).
- Net pay (take-home pay): The amount actually deposited or paid to you after taxes and all deductions.
- Taxable income: The portion of pay on which income tax is calculated. In this calculator it is gross pay minus pre-tax deductions: \(\max(\text{Gross} - \text{Pre-Tax},\,0)\).
- Pre-tax deductions: Amounts taken out before income tax is figured, which lowers the taxable base. Common US examples include traditional 401(k) contributions, Health Savings Account (HSA) contributions, and employee-paid health insurance premiums under a cafeteria plan. (Some of these may still be subject to FICA, depending on the type.)
- Post-tax deductions: Amounts taken out after tax is calculated, which do not reduce taxable income. Examples: Roth 401(k) contributions, union dues, and wage garnishments.
- Effective tax rate: Total tax paid divided by total income, i.e. the average rate across all your income.
- Marginal tax rate: The rate applied to your next dollar of income, i.e. the top bracket your income reaches under a progressive system.
- FICA: US payroll taxes funding Social Security and Medicare. The employee share is 6.2% for Social Security (applied up to an annual wage base that is adjusted each year) and 1.45% for Medicare, totaling 7.65%. Higher earners may owe an Additional Medicare Tax on wages above certain thresholds.
- Pay period: How often you are paid, such as weekly (52 per year), biweekly (26), semi-monthly (24), or monthly (12). Enter amounts for a single pay period so the result is per paycheck.
Interpreting Your Net Pay Result
The calculator computes tax as a single flat percentage of taxable pay: \(T = \max(\text{Gross} - \text{Pre-Tax},\,0) \times \frac{\text{Tax Rate}}{100}\), then \(\text{Net Pay} = \text{Gross} - T - \text{Pre-Tax} - \text{Post-Tax}\).
What the percent-of-gross-kept figure means
This figure is net pay divided by gross pay, expressed as a percentage. It shows how much of each gross dollar remains after taxes and all deductions. A lower figure can come from higher taxes or from larger deductions, including voluntary ones such as retirement contributions that you still own, so it is not purely a measure of tax burden.
Why estimates differ from an actual pay stub
- Progressive brackets: Real income tax applies different rates to different slices of income. A single flat rate approximates this, so it works best if you enter your effective rate rather than your top marginal rate.
- Filing status and withholding forms: In the US, filing status, dependents, and Form W-4 entries change how much is withheld each period.
- State and local taxes: These vary widely by location, and some places have none. You can fold them into the rate you enter.
- FICA and the wage base: Social Security tax (6.2%) stops once annual wages pass the yearly wage base, while Medicare (1.45%) continues. Paychecks late in the year can therefore be larger for high earners. This calculator does not model that unless you include FICA in your rate.
- Per-period withholding methods: Employers annualize each paycheck using IRS or other tax-authority methods, so a bonus or irregular pay can be withheld at a different rate than regular pay. Final tax is settled when you file your return.
Pre-tax versus post-tax deductions
Pre-tax deductions are subtracted before the tax rate is applied, so they shrink the taxable base and reduce the tax computed. Post-tax deductions are subtracted only after tax, so they do not change the tax. For the same dollar amount, a pre-tax deduction therefore lowers net pay by less than a post-tax one when the tax rate is above zero.
This tool provides an estimate for general information only and is not tax, legal, or financial advice.
Income and jobs: United States
Average income and unemployment in United States compared with the world, from the World Bank: a benchmark for the figures you enter above.
- GNI per capita 2025
- 88,810 USD
- GDP per capita, PPP 2025
- 90,027 intl. $
- World: 25,704
- Unemployment 2025
- 4.2%
- World: 4.8%
Latest change Up +7.1% 2025: 88,810 USD, against 82,910 USD in 2024. CalculatorLib computes this change from the two published figures.
In 2025, gross national income per person in United States was 88,810 US dollars a year, about 7,401 US dollars a month. World: 14,244 USD
| Year | GNI per capita (USD) | GDP per capita, PPP (intl. $) | Unemployment |
|---|---|---|---|
| 2025 | 88,810 | 90,027 | 4.2% |
| 2024 | 82,910 | 86,170 | 4.0% |
| 2023 | 79,950 | 82,587 | 3.6% |
| 2022 | 77,230 | 78,009 | 3.7% |
| 2021 | 71,510 | 71,441 | 5.3% |
| 2020 | 64,630 | 64,465 | 8.1% |
| 2019 | 65,840 | 65,228 | 3.7% |
| 2018 | 63,040 | 62,876 | 3.9% |
| 2017 | 58,860 | 60,048 | 4.4% |
| 2016 | 56,830 | 57,977 | 4.9% |
GNI per capita (Atlas method) is the average of all income in the economy, not a typical salary; PPP dollars adjust for local prices.
Income tax and social security: United States
- Top income tax rate 2025
- 43.65%
- from 8.7 × the average wage
- Employee social security 2025
- 7.65% · 1.45%
In 2025, the top statutory personal income tax rate in United States (central and local government combined) was 43.65%. It applies from 8.7 times the average wage of 73,520 USD, that is from about 642,101 USD a year.
Employee social security contribution rates for successive earnings bands, lowest band first; the band limits are not shown.
Top income tax rates in OECD countries
| Country | Top rate | Applies from (× average wage) | Year |
|---|---|---|---|
| Japan | 55.95% | 7.7 | 2025 |
| France | 55.37% | 12.9 | 2025 |
| South Korea | 49.5% | 19.0 | 2025 |
| Germany | 47.48% | 4.4 | 2025 |
| United Kingdom | 45% | 2.2 | 2025 |
| United States | 43.65% | 8.7 | 2025 |
| Türkiye | 40.76% | 5.6 | 2025 |
| Mexico | 35% | 20.6 | 2025 |
The top rate is the statutory rate on the highest earnings, not the rate most workers pay. OECD figures cover OECD member countries only.
United States and other countries
GNI per capita in current US dollars (Atlas method) — each country’s latest published year.
- United States 88,810 USD (2025)
- France 48,630 USD (2025)
- Japan 38,340 USD (2025)
- South Korea 37,880 USD (2025)
- Saudi Arabia 36,070 USD (2025)
- Türkiye 16,300 USD (2025)
- Russia 15,960 USD (2025)
- World 14,244 USD (2025)
- China 14,230 USD (2025)
- Mexico 13,730 USD (2025)
- Vietnam 4,970 USD (2025)
- India 2,760 USD (2025)
No published figure yet for Taiwan.
Years can differ between rows: each figure is shown with its own year. The same World Bank indicator for every country.
Latest figure: 2025 Data last updated 2026-10-18 · current
Source: The World Bank Group CC BY 4.0; OECD, Tax Database CC BY 4.0
Monthly figures are computed by CalculatorLib from these data. The top-rate threshold in national currency (multiple × average wage) is computed by CalculatorLib from these data.
Source details and methodology
- The World Bank Group — World Development Indicators (NY.GNP.PCAP.CD, NY.GDP.PCAP.PP.CD, SL.UEM.TOTL.ZS)
- OECD, Tax Database — Top statutory personal income tax rate; employee social security contribution rates
FAQ
Is this an exact paycheck figure? No — it is an estimate. Actual withholding depends on tax brackets, filing status, and local rules. Use it as a planning guide.
What tax rate should I enter? Use your effective (average) rate, not your top marginal bracket. Check a recent pay stub to estimate the blended percentage.
Do pre-tax deductions really save money? Yes — because they lower the income that gets taxed, they reduce both your taxable base and your tax bill compared with post-tax deductions of the same amount.