What is the Weibull Distribution Percentile Calculator?
This tool computes the percentile (also called the quantile or inverse CDF) of a two-parameter Weibull distribution. Given the shape parameter m, the scale parameter eta, and a cumulative probability, it returns the value x at which the distribution reaches that probability. It is a pure statistics tool that applies everywhere with no region-specific rules.
The Weibull distribution
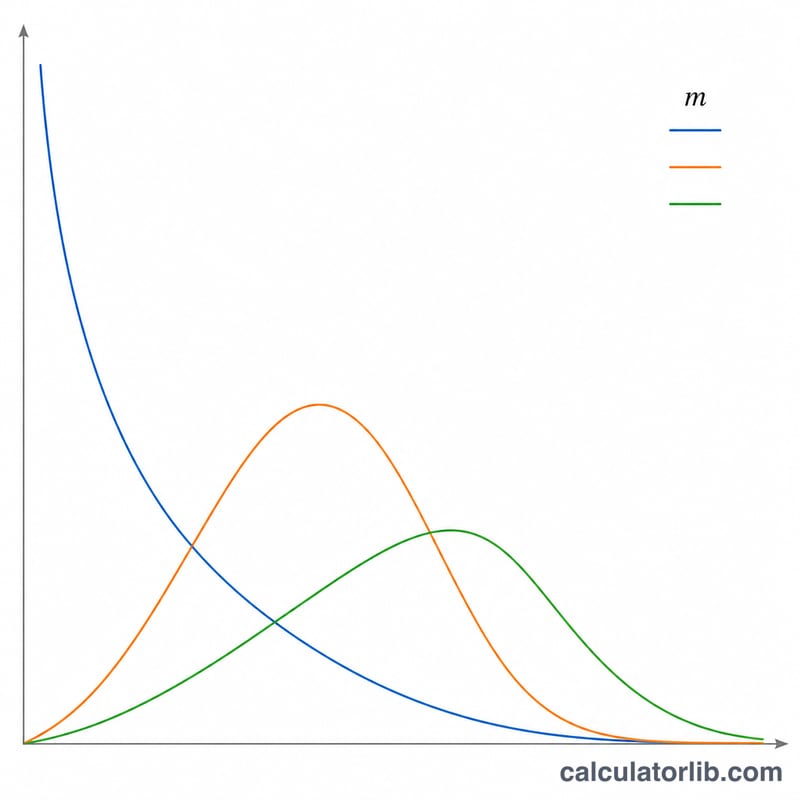
The two-parameter Weibull distribution has a shape parameter \(m\) (sometimes written \(k\) or \(\beta\)) and a scale parameter \(\eta\) (sometimes written \(\alpha\) or \(\lambda\)), both strictly positive, with support \(x \ge 0\). Its lower cumulative distribution function is $$P = F(x) = 1 - \exp\left(-\left(\frac{x}{\eta}\right)^{m}\right).$$ The upper (survival) probability is $$Q = 1 - F(x) = \exp\left(-\left(\frac{x}{\eta}\right)^{m}\right),$$ so \(P + Q = 1\).
The quantile formula
Solving \(P = 1 - \exp\left(-\left(\frac{x}{\eta}\right)^{m}\right)\) for \(x\) gives the inverse CDF: $$x = \eta\left(-\ln\left(1-P\right)\right)^{\frac{1}{m}}.$$ If you supply an upper-tail probability \(Q\) instead, the calculator first converts it via \(P = 1 - Q\), so equivalently $$x = \eta\left(-\ln\left(Q\right)\right)^{\frac{1}{m}}.$$ The output \(x\) carries whatever unit the scale parameter represents (hours, cycles, etc.).
How to use it
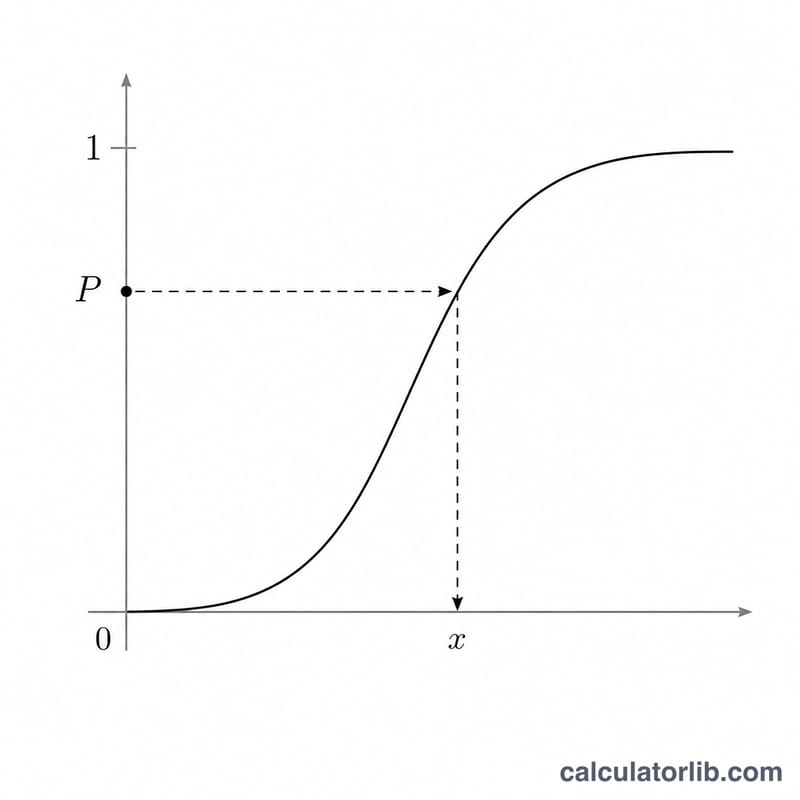
Enter the shape parameter m and scale parameter eta. Choose whether your probability value is a lower cumulative probability P or an upper cumulative probability Q, then enter the probability strictly between 0 and 1. The result is the percentile x.
Worked example
With \(m = 2\), \(\eta = 1\), lower probability \(P = 0.5\): \(-\ln(1 - 0.5) = 0.693147\), and \(0.693147^{\frac{1}{2}} = 0.832555\), so $$x = 1 \times 0.832555 = 0.83255.$$ This is the median of the Weibull(2, 1) (Rayleigh) distribution.
FAQ
What if I have the reliability (survival) probability? That is the upper probability \(Q\); select "Upper cumulative probability Q" and enter it directly.
Why must the probability be strictly between 0 and 1? As \(P\) approaches 1 the percentile tends to infinity, and at \(P = 0\) it is 0; values at or beyond the boundaries make the logarithm undefined.
Can the result be negative? No. The Weibull support is \(x \ge 0\), so the percentile is always non-negative.


