什么是均值标准误?
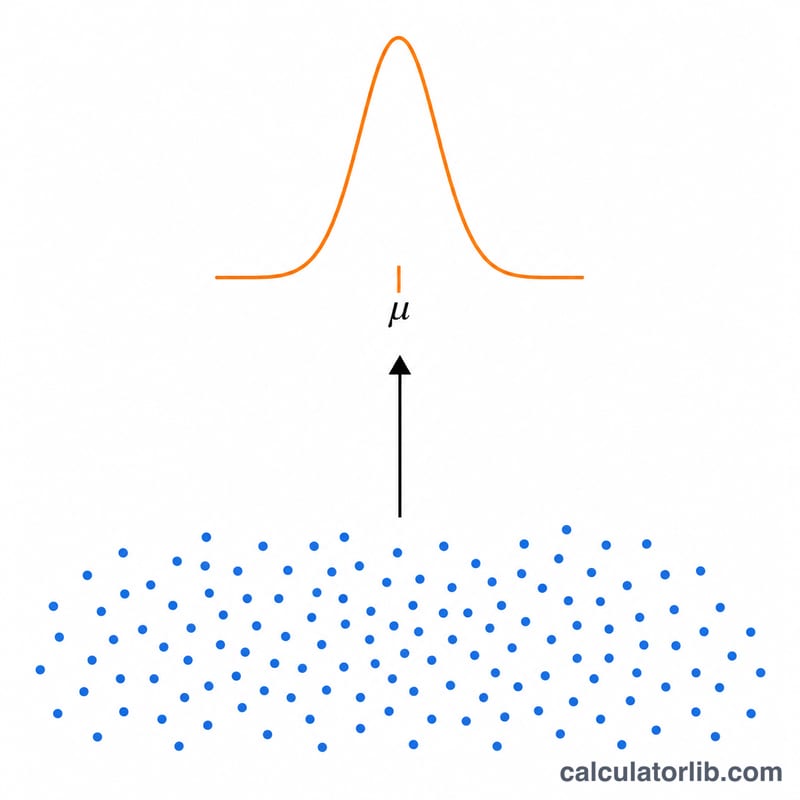
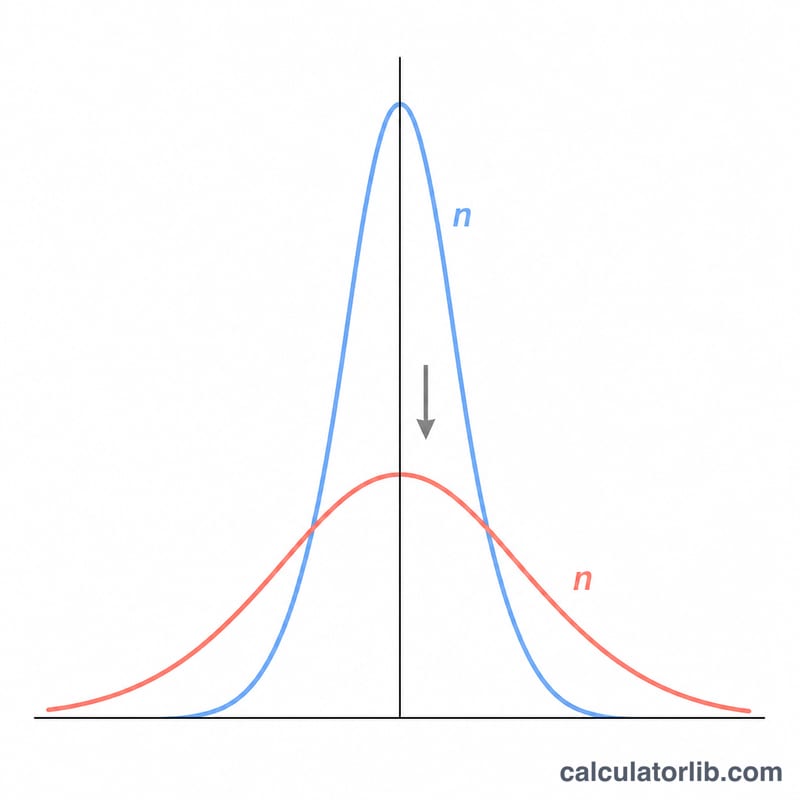
均值标准误(SEM)用来衡量样本均值与真实总体均值之间预期的偏差大小。标准差描述的是单个数据点的离散程度,而标准误反映的则是你对平均值这一估计的精确度。样本越大,标准误越小,也就意味着样本均值越能可靠地代表总体均值。
如何使用本计算器
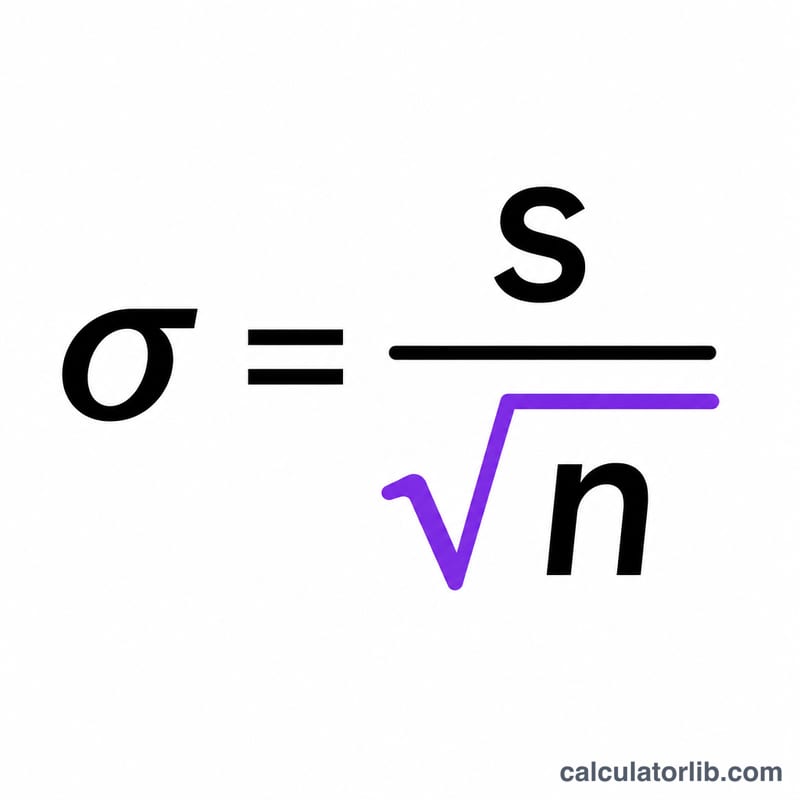
填入样本标准差(s)和样本量(n),即可直接读取结果。计算器会用标准差除以样本量的平方根。如果你手头只有原始数据,请先算出标准差,再连同观测个数一起输入到这里。
公式详解
计算公式为 $$\text{SEM} = \frac{s}{\sqrt{n}}$$。其中,\(s\) 是样本标准差,\(n\) 是观测个数。由于 \(n\) 处在平方根之下,样本量扩大到原来的 4 倍,标准误也只会减小一半——在规划研究方案时,这是一条非常实用的经验法则。
Advertisement
实例演算
假设一组包含 25 个测量值的样本,其标准差为 15。那么 $$\text{SEM} = \frac{15}{\sqrt{25}} = \frac{15}{5} = 3$$。也就是说,样本均值的标准误为 3 个单位。常见的 95% 置信区间大致就是均值 \(\pm 1.96 \times 3\)。
Advertisement
常见问题
SEM 和标准差是一回事吗?不是。标准差衡量的是数据点之间的离散程度;而 SEM 衡量的是样本均值作为总体均值估计值时的波动程度。
为什么样本越大,SEM 越小?对更多观测值取平均能够削弱随机误差,因此均值会成为一个更稳定的估计。
如果我只知道总体标准差怎么办?你依然可以用它来代替 \(s\),公式不变,仍然是 \(s / \sqrt{n}\)。