What Is the Standard Error of the Mean?
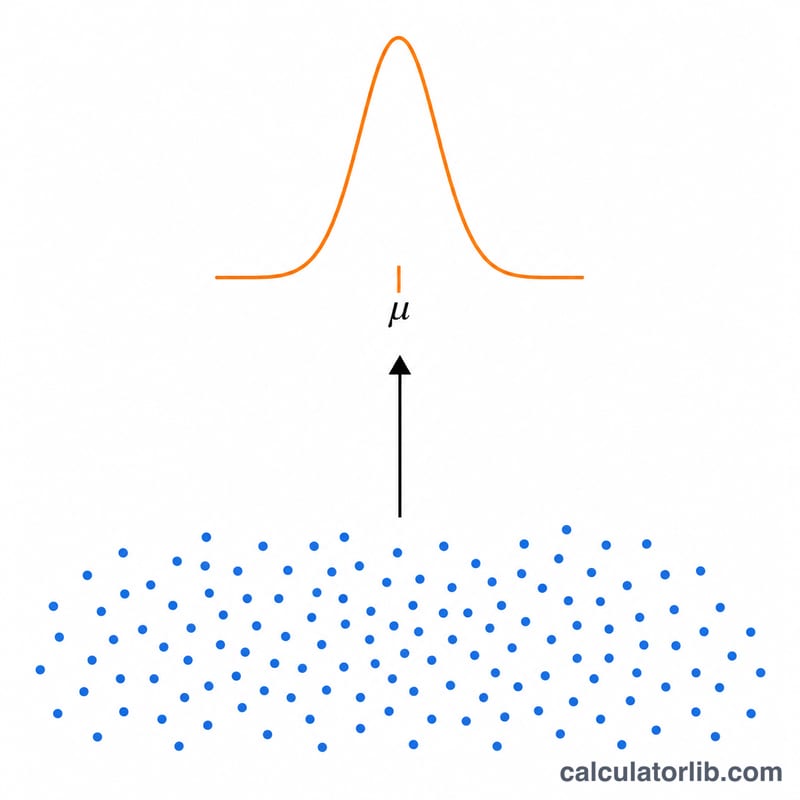
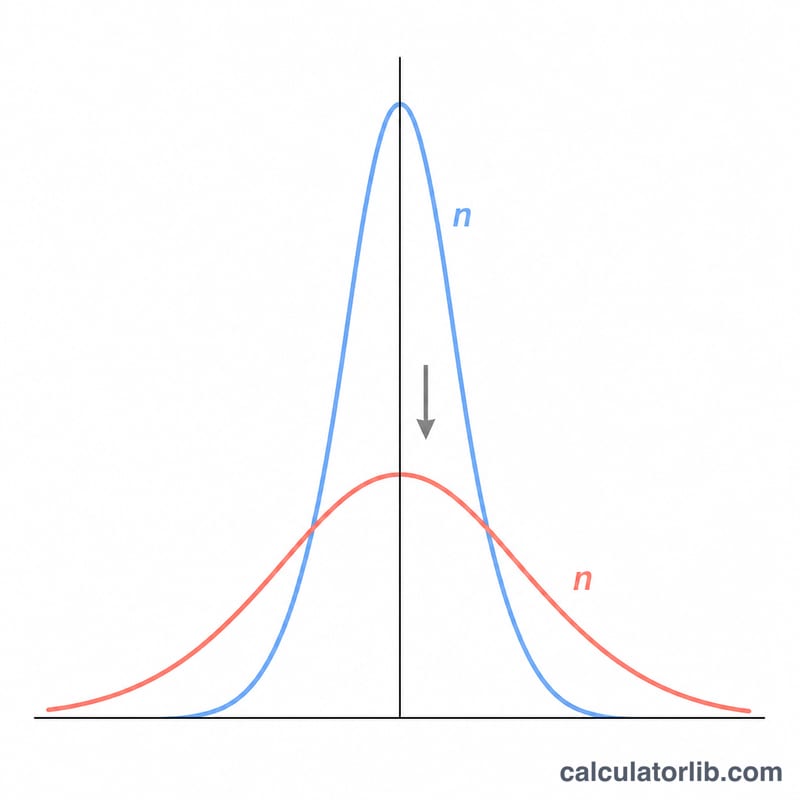
The standard error of the mean (SEM) measures how much the mean of a sample is expected to vary from the true population mean. While the standard deviation describes the spread of individual data points, the SEM describes the precision of your estimate of the average. Larger samples produce smaller standard errors, meaning your sample mean is a more reliable estimate of the population mean.
How to Use This Calculator
Enter your sample standard deviation (s) and your sample size (n), then read the result. The calculator divides the standard deviation by the square root of the sample size. If you only have raw data, first compute the standard deviation, then enter it here along with the number of observations.
The Formula Explained
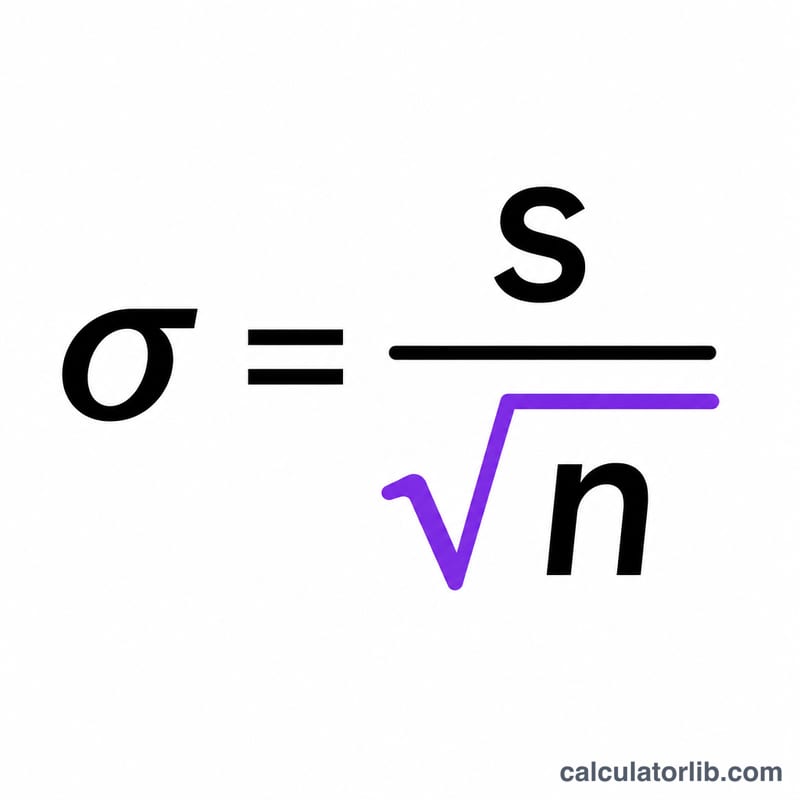
The formula is $$\text{SEM} = \frac{\text{Std. Dev. (s)}}{\sqrt{\text{Sample Size (n)}}}$$. Here, \(s\) is the sample standard deviation and \(n\) is the number of observations. Because n appears under a square root, quadrupling the sample size only halves the standard error — a useful rule of thumb when planning studies.
Worked Example
Suppose a sample of 25 measurements has a standard deviation of 15. The SEM is $$\frac{15}{\sqrt{25}} = \frac{15}{5} = 3.$$ So the sample mean is estimated with a standard error of 3 units. A common 95% confidence interval would then be roughly the mean \(\pm 1.96 \times 3\).
FAQ
Is SEM the same as standard deviation? No. Standard deviation measures variability among data points; SEM measures variability of the sample mean as an estimate of the population mean.
Why does SEM shrink with larger samples? Averaging more observations reduces random error, so the mean becomes a more stable estimate.
What if I only know the population standard deviation? You can still use it in place of s; the formula remains \(s / \sqrt{n}\).


