
What is Mean Squared Error?
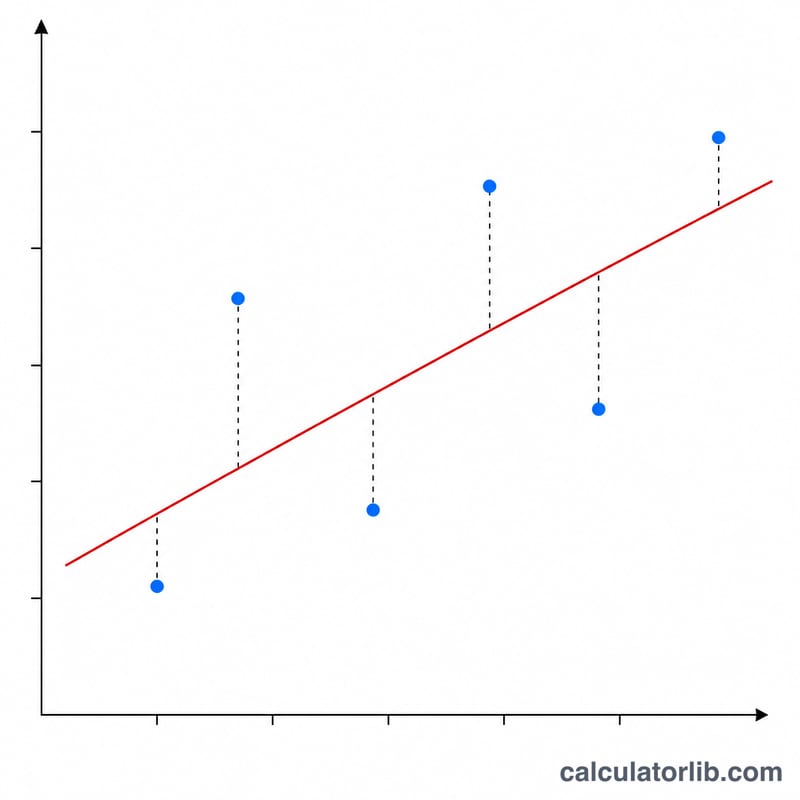
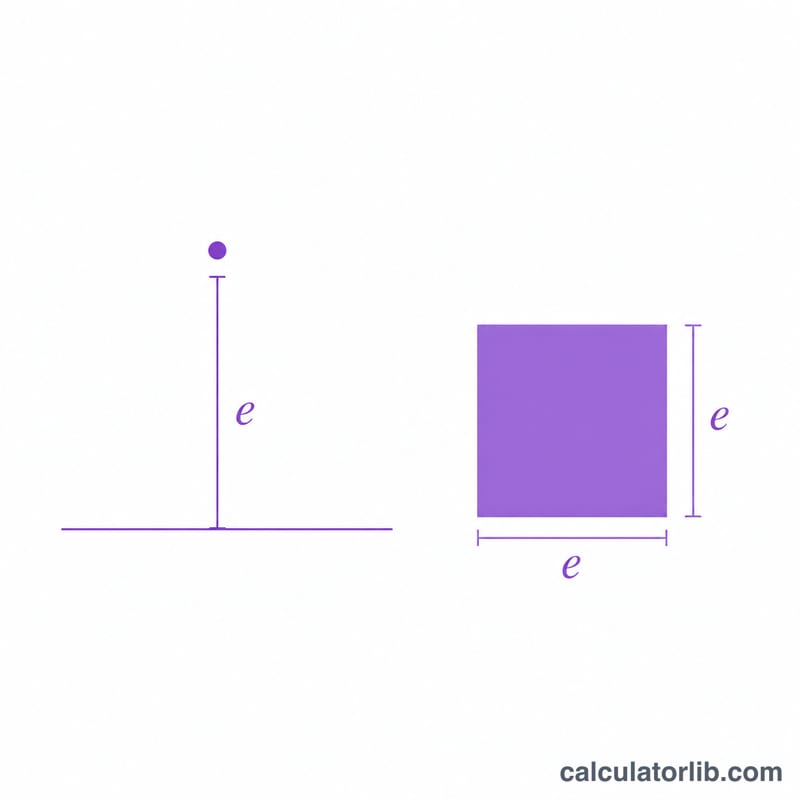
Mean Squared Error (MSE) is one of the most widely used metrics for measuring how close a set of predictions is to the actual observed values. It averages the squared differences between each predicted value (\(\hat{y}\)) and its corresponding actual value (\(y\)). Because the errors are squared, larger mistakes are penalized more heavily than small ones, and the result is always non-negative — a perfect model scores exactly 0.
How to use this calculator
Enter your actual values and predicted values as two comma-separated lists. The lists should be the same length, with each predicted value lining up with the actual value in the same position. The calculator pairs them in order, computes the squared error for each pair, and returns the MSE along with the related RMSE (root mean squared error) and SSE (sum of squared errors). If the two lists differ in length, only the overlapping pairs are used.
The formula explained
The MSE formula is $$\text{MSE} = \frac{1}{n}\sum_{i=1}^{n}\left(y_i - \hat{y}_i\right)^2$$ For each data point you subtract the prediction from the actual value, square that difference, add all the squared differences together (this is the SSE), and finally divide by the number of points \(n\). Taking the square root of the MSE gives the RMSE, which is convenient because it shares the same units as the original data.
Worked example
Suppose the actual values are 3, −0.5, 2, 7 and the predictions are 2.5, 0.0, 2, 8. The errors are 0.5, −0.5, 0, −1. Squaring gives 0.25, 0.25, 0, 1, which sum to 1.5 (the SSE). Dividing by \(n = 4\) gives an MSE of 0.375, and the RMSE is \(\sqrt{0.375} \approx 0.6124\).
FAQ
What is a good MSE value? There is no universal threshold — MSE depends on the scale of your data. Lower is always better, and 0 means a perfect fit. Compare it against alternative models or against the variance of the target.
What is the difference between MSE and RMSE? RMSE is just the square root of MSE. RMSE is often preferred for reporting because it is in the same units as the data and is easier to interpret.
Why square the errors instead of using absolute values? Squaring makes the function smooth and differentiable (useful for optimization) and penalizes large errors more strongly. The alternative, Mean Absolute Error (MAE), treats all errors linearly.


