What is the Cauchy distribution?
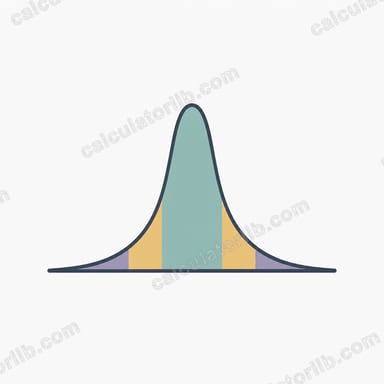
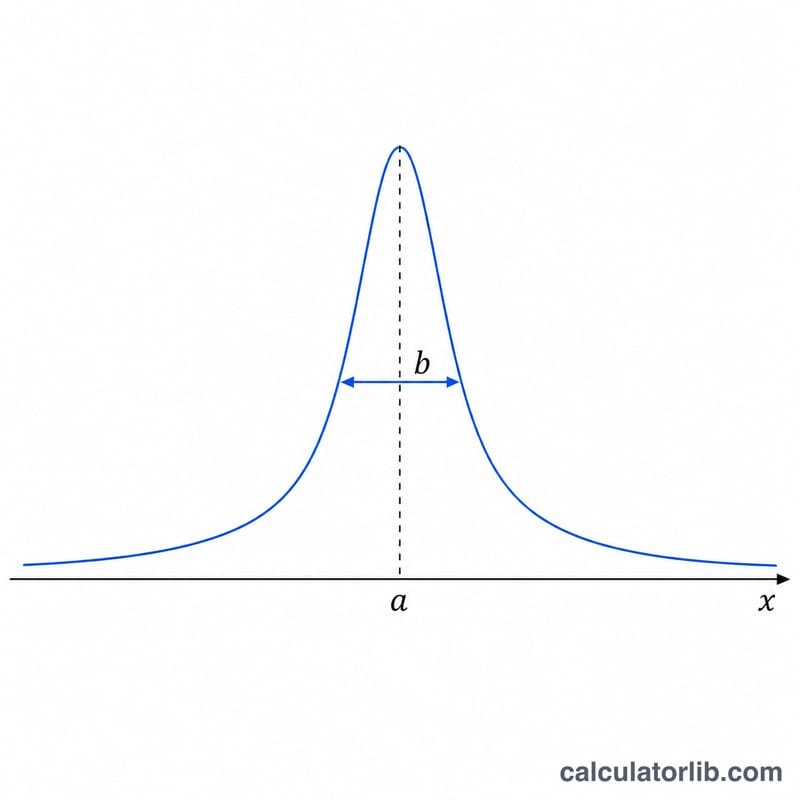
The Cauchy distribution, also called the Lorentz distribution, is a continuous probability distribution defined by a location parameter a (the median and peak position) and a scale parameter b > 0 (the half-width at half-maximum). It is famous for its heavy tails: it has no finite mean and no finite variance. This calculator evaluates the distribution over a sequence of x values so you can build a plot-ready table of (x, value) pairs.
How to use this calculator
Pick a function: probability density f, lower cumulative probability P, or upper cumulative probability Q. Enter the location a and scale b (must be positive). Then define the x sequence with an initial value, a step increment, and the number of points. The k-th x is x_k = xInitial + k * xStep for k = 0 to count-1. The defaults sweep x from -5 to +5 in steps of 0.1 (101 points).
The formulas
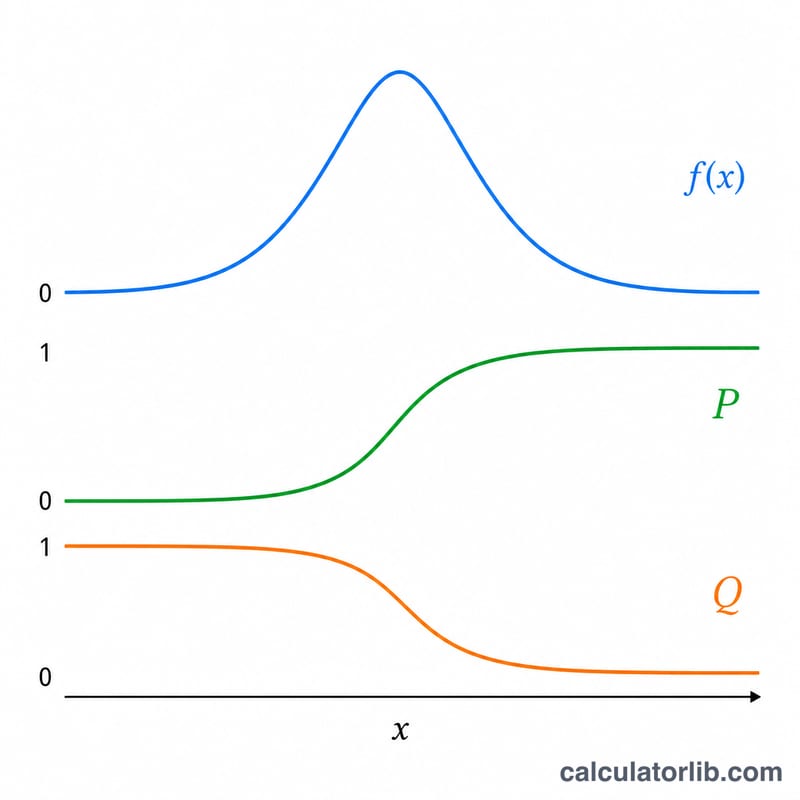
Let \(z = (x - a) / b\). The density is $$f = \frac{1}{\pi} \cdot \frac{b}{(x-a)^2 + b^2},$$ equivalently \(\frac{1}{\pi b (1 + z^2)}\). The lower cumulative distribution is $$P = \frac{1}{2} + \frac{1}{\pi}\arctan(z),$$ and the upper (survival) function is $$Q = 1 - P = \frac{1}{2} - \frac{1}{\pi}\arctan(z).$$ Because arctan stays within \((-\pi/2, \pi/2)\), both P and Q remain strictly between 0 and 1.
Worked example
With \(a = 0\), \(b = 0.7\), evaluate density at \(x = 1\): \((x-a)^2 + b^2 = 1 + 0.49 = 1.49\), so $$f = \frac{1}{\pi}\left(\frac{0.7}{1.49}\right) \approx 0.14954.$$ For the lower cumulative at the same point, \(\arctan(1/0.7) = 0.96007\), so $$P = 0.5 + \frac{0.96007}{\pi} \approx 0.80559,$$ and \(Q = 1 - 0.80559 = 0.19441\). At the peak \(x = a\), \(f = \frac{1}{\pi b}\) and \(P = Q = 0.5\).
FAQ
Why must b be positive? A non-positive scale makes the density and CDF undefined (zero or negative width), so the calculator clamps b to a tiny positive value.
Why is there no mean shown? The Cauchy distribution has undefined mean and variance due to its heavy tails; this tool only reports pointwise density and tail probabilities.
What is the "value" column? It is the chosen function (f, P, or Q) evaluated at each x, ready to plot with x on the horizontal axis.


