Connect via MCP →

Enter Calculation

Formula

Advertisement

Results

Values at first grid point x = 0
0
Probability density f(x)
Gamma distribution, shape a = 3, scale b = 1 · 101 points
x f(x) P(x) Q(x)
0 0 0 1
0.1 0.004524 0.000155 0.999845
0.2 0.016375 0.001148 0.998852
0.3 0.033337 0.003599 0.996401
0.4 0.053626 0.007926 0.992074
0.5 0.075816 0.014388 0.985612
0.6 0.098786 0.023115 0.976885
0.7 0.121663 0.034142 0.965858
0.8 0.143785 0.047423 0.952577
0.9 0.164661 0.062857 0.937143
1 0.18394 0.080301 0.919699
1.1 0.201387 0.099584 0.900416
1.2 0.21686 0.120513 0.879487
1.3 0.230289 0.142888 0.857112
1.4 0.241665 0.166502 0.833498
1.5 0.251021 0.191153 0.808847
1.6 0.258428 0.216642 0.783358
1.7 0.263978 0.242777 0.757223
1.8 0.267784 0.269379 0.730621
1.9 0.269971 0.29628 0.70372
2 0.270671 0.323324 0.676676
2.1 0.270016 0.350369 0.649631
2.2 0.268144 0.377286 0.622714
2.3 0.265185 0.403961 0.596039
2.4 0.261268 0.430291 0.569709
2.5 0.256516 0.456187 0.543813
2.6 0.251045 0.48157 0.51843
2.7 0.244964 0.506376 0.493624
2.8 0.238375 0.530546 0.469454
2.9 0.231373 0.554037 0.445963
3 0.224042 0.57681 0.42319
3.1 0.216461 0.598837 0.401163
3.2 0.208702 0.620096 0.379904
3.3 0.200829 0.640574 0.359426
3.4 0.192898 0.66026 0.33974
3.5 0.184959 0.679153 0.320847
3.6 0.177058 0.697253 0.302747
3.7 0.169233 0.714567 0.285433
3.8 0.161517 0.731103 0.268897
3.9 0.15394 0.746875 0.253125
4 0.146525 0.761897 0.238103
4.1 0.139293 0.776186 0.223814
4.2 0.132261 0.789762 0.210238
4.3 0.125441 0.802645 0.197355
4.4 0.118845 0.814858 0.185142
4.5 0.112479 0.826422 0.173578
4.6 0.106348 0.837361 0.162639
4.7 0.100457 0.8477 0.1523
4.8 0.094807 0.857461 0.142539
4.9 0.089396 0.866669 0.133331
5 0.084224 0.875348 0.124652
5.1 0.079288 0.883522 0.116478
5.2 0.074584 0.891213 0.108787
5.3 0.070107 0.898446 0.101554
5.4 0.065852 0.905242 0.094758
5.5 0.061812 0.911624 0.088376
5.6 0.057983 0.917612 0.082388
5.7 0.054355 0.923227 0.076773
5.8 0.050923 0.928489 0.071511
5.9 0.04768 0.933418 0.066582
6 0.044618 0.938031 0.061969
6.1 0.041729 0.942347 0.057653
6.2 0.039006 0.946382 0.053618
6.3 0.036441 0.950154 0.049846
6.4 0.034029 0.953676 0.046324
6.5 0.03176 0.956964 0.043036
6.6 0.029629 0.960032 0.039968
6.7 0.027628 0.962894 0.037106
6.8 0.02575 0.965562 0.034438
6.9 0.02399 0.968048 0.031952
7 0.022341 0.970364 0.029636
7.1 0.020797 0.97252 0.02748
7.2 0.019352 0.974526 0.025474
7.3 0.018 0.976393 0.023607
7.4 0.016736 0.978129 0.021871
7.5 0.015555 0.979743 0.020257
7.6 0.014453 0.981243 0.018757
7.7 0.013424 0.982636 0.017364
7.8 0.012464 0.98393 0.01607
7.9 0.011569 0.985131 0.014869
8 0.010735 0.986246 0.013754
8.1 0.009958 0.98728 0.01272
8.2 0.009234 0.988239 0.011761
8.3 0.00856 0.989129 0.010871
8.4 0.007933 0.989953 0.010047
8.5 0.00735 0.990717 0.009283
8.6 0.006808 0.991424 0.008576
8.7 0.006304 0.99208 0.00792
8.8 0.005836 0.992686 0.007314
8.9 0.005402 0.993248 0.006752
9 0.004998 0.993768 0.006232
9.1 0.004624 0.994249 0.005751
9.2 0.004276 0.994693 0.005307
9.3 0.003954 0.995105 0.004895
9.4 0.003655 0.995485 0.004515
9.5 0.003378 0.995836 0.004164
9.6 0.003121 0.996161 0.003839
9.7 0.002883 0.996461 0.003539
9.8 0.002663 0.996738 0.003262
9.9 0.002459 0.996994 0.003006
10 0.00227 0.997231 0.002769

What this calculator does

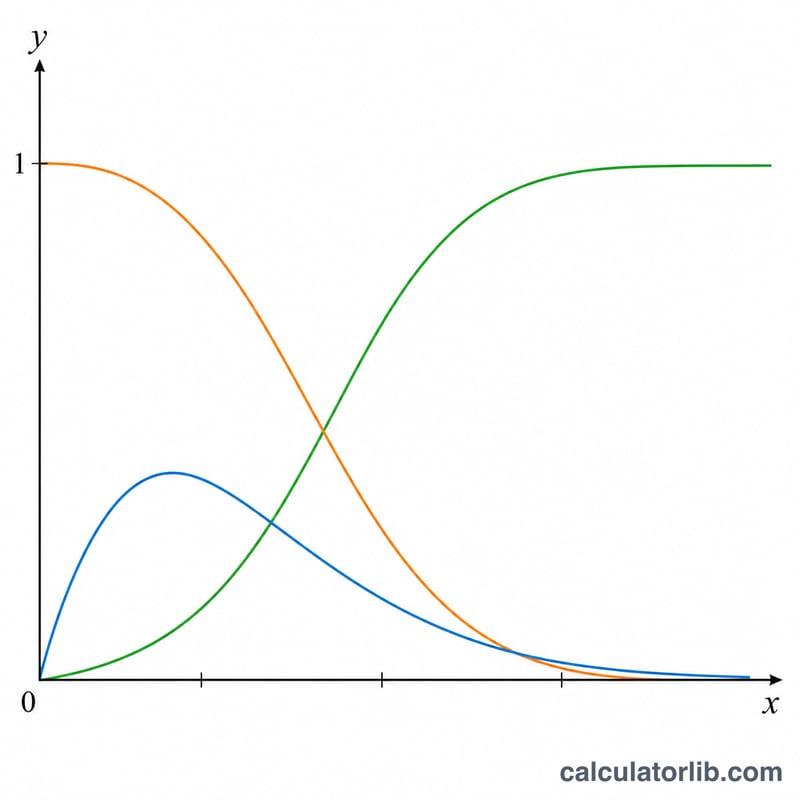
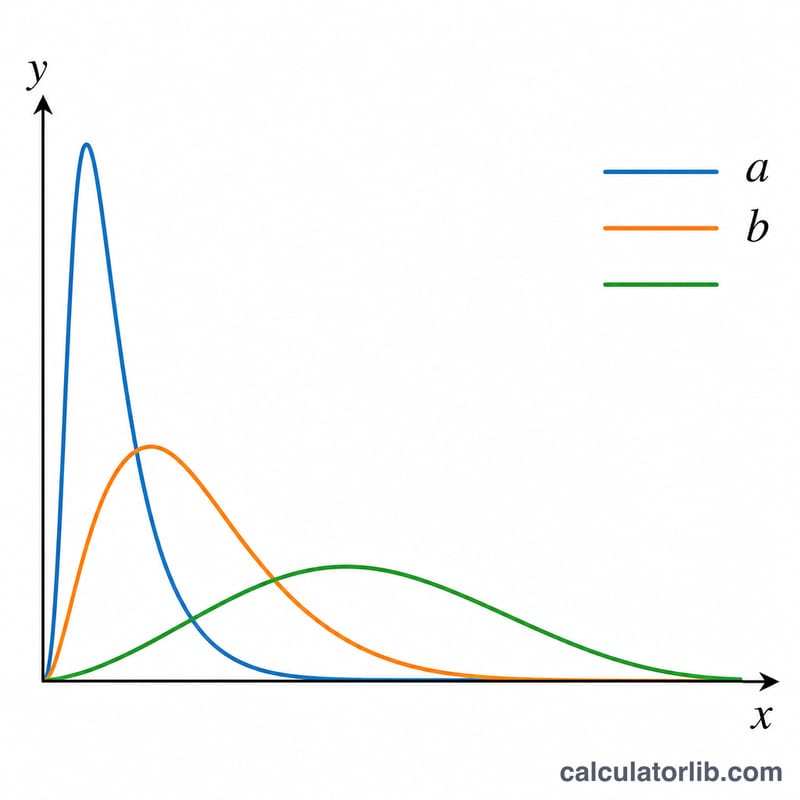
The Gamma Distribution Graph Calculator evaluates the Gamma distribution across a grid of x-values and returns three related quantities at each point: the probability density f(x), the lower cumulative probability P(x) and the upper cumulative (survival) probability Q(x). The Gamma distribution is a continuous distribution defined for x > 0 and is widely used in reliability engineering, queuing models, rainfall modelling and Bayesian statistics. The calculator uses the scale parameterisation (shape a, scale b), not the rate parameterisation.

Gamma distribution PDF, CDF and survival curves on shared axes
The PDF f(x), lower cumulative P(x) and upper cumulative Q(x) of a Gamma distribution.

The inputs you provide

  • Function selection — choose which curve to compute: density f, lower cumulative P, or upper cumulative Q.
  • Shape parameter a — must be positive; controls the curve's skew and peak.
  • Scale parameter b — must be positive; stretches the distribution along the x-axis (mean = \(a\cdot b\)).
  • Initial value of x — the starting point of the grid.
  • Increment (step) of x — the spacing between successive x-values.
  • Repeat count (points) — how many grid points to generate (capped at 10,000).

If a or b are non-positive they are clamped to a tiny value, a step ≤ 0 defaults to 0.1, and the point count is forced into the range 1–10,000.

Advertisement
Effect of shape and scale parameters on Gamma PDF shape
How the shape a and scale b parameters change the Gamma density curve.

The formula

The probability density function is:

$$f(x, a, b) = \frac{x^{\,a-1}\,e^{-x/b}}{\Gamma(a)\cdot b^{\,a}}$$

The lower cumulative P(x) is the regularised incomplete gamma function \(P(a, x/b)\), computed via a series expansion when \(x/b < a+1\) and a continued fraction otherwise. The upper cumulative (survival) \(Q(x) = 1 - P(x)\). The gamma function \(\Gamma(a)\) is obtained from the Lanczos approximation in log form for numerical stability.

Worked example

Suppose \(a = 2\), \(b = 1\), starting \(x = 0\), step = 1, and 4 points (\(x = 0, 1, 2, 3\)). The density at \(x = 2\) is $$f = \frac{2^{1}\cdot e^{-2}}{\Gamma(2)\cdot 1} = \frac{2\cdot 0.1353}{1} = 0.2707.$$ The lower cumulative at \(x = 2\) is \(P(2, 2) \approx 0.5940\), so the survival probability \(Q(2) \approx 0.4060\). Each grid point returns these values, ready to plot as a smooth curve.

FAQ

Does this use scale or rate? It uses the scale parameter b. If you have a rate λ instead, set \(b = 1/\lambda\).

What is the difference between P and Q? P(x) is the probability that the variable is at most x (cumulative from the left); \(Q(x) = 1 - P(x)\) is the probability of exceeding x, often called the survival function.

Why must a and b be positive? The Gamma distribution is only defined for positive shape and scale. Non-positive entries are replaced with a near-zero value to avoid errors, but you should supply valid positive numbers for meaningful results.

Last updated: