What this calculator does
This calculator estimates the cash dividends you can expect each year after investing a lump sum in a high-dividend-yield ETF. Enter the amount invested, the ETF trailing or forward yield, an optional annual dividend growth rate, a holding period and your dividend tax rate. It returns the annual, quarterly and monthly payout, the after-tax income and the cumulative dividends over the period.
How to use it
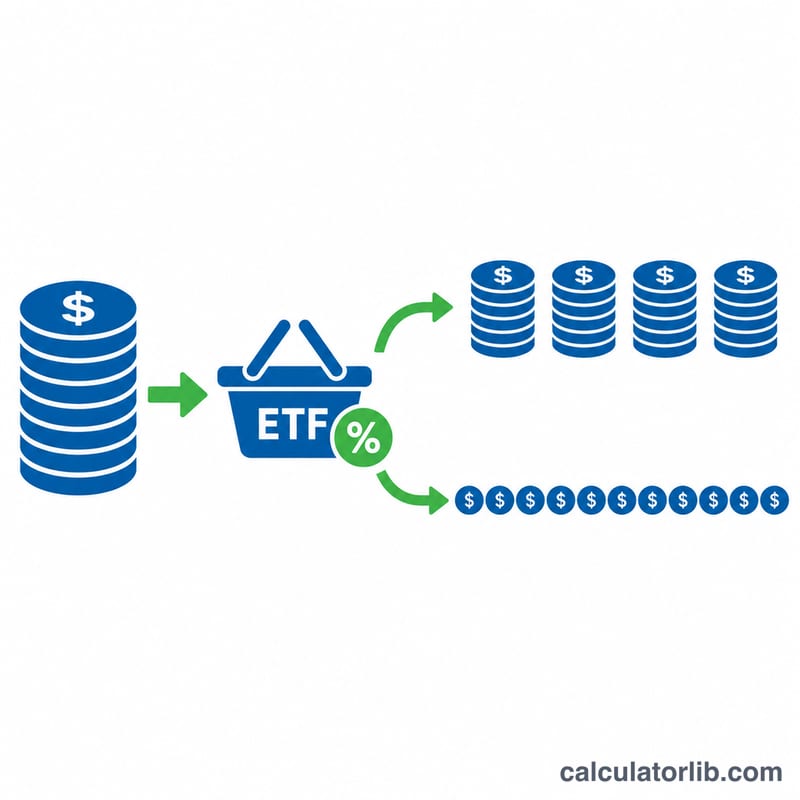
Type the amount you plan to invest, then the distribution yield shown on the fund factsheet. If you expect the fund dividend to rise, add a growth percentage; leave it at 0 for a flat payout. Add your tax rate on dividends to see what lands in your account after tax.
The formula explained
The first-year payout is the investment multiplied by the yield:
$$D_1 = P \times \frac{y}{100}$$Here \(P\) is the amount invested and \(y\) is the yield in percent. With dividend growth \(g\) (as a decimal), the payout in year \(n\) is \(D_n = D_1(1+g)^{n-1}\) and the cumulative total is:
$$D_{total} = D_1 \times \frac{(1+g)^n - 1}{g}$$If \(g = 0\), the total is simply \(D_1 \times n\). The after-tax figure multiplies by \(1 - t/100\).
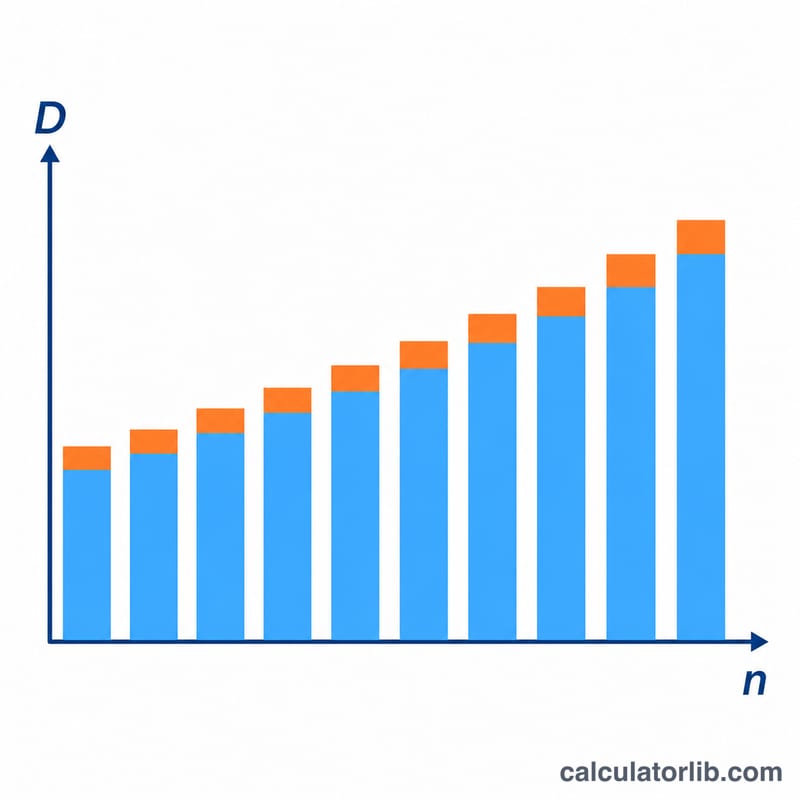
Worked example
Invest 100,000 at a 3.5% yield with 5% annual dividend growth for 5 years and no tax:
$$D_1 = 100000 \times 0.035 = 3500$$$$D_5 = 3500 \times 1.05^4 \approx 4254.27$$$$D_{total} = 3500 \times \frac{1.05^5 - 1}{0.05} \approx 19339.71$$The model assumes the share price stays constant and dividends are not reinvested, so it is an estimate rather than a forecast.
Payout Comparison Across Yields and Growth Rates
The table compares four illustrative scenarios for a fixed investment of $100,000 held for 10 years with a 15% tax rate on dividends. The yields, growth rates and tax rate are assumptions chosen for illustration, not forecasts or typical figures for any specific fund or country. Year-1 payout is \(D_1 = P \cdot y/100\), the monthly figure is \(D_1/12\), and the after-tax payout is \(D_1(1-0.15)\). Cumulative dividends use \(D_1 \cdot \frac{(1+g)^{n}-1}{g}\) when \(g>0\), and \(D_1 \cdot n\) when \(g=0\).
| Scenario | Yield | Growth | Tax rate | Year-1 annual payout (gross) | Monthly payout (gross) | After-tax annual payout (year 1) | Cumulative dividends over 10 years (gross / after-tax) |
|---|---|---|---|---|---|---|---|
| A | 2% | 0% | 15% | $2,000.00 | $166.67 | $1,700.00 | $20,000.00 / $17,000.00 |
| B | 3.5% | 5% | 15% | $3,500.00 | $291.67 | $2,975.00 | $44,022.62 / $37,419.23 |
| C | 5% | 0% | 15% | $5,000.00 | $416.67 | $4,250.00 | $50,000.00 / $42,500.00 |
| D | 6% | 2% | 15% | $6,000.00 | $500.00 | $5,100.00 | $65,698.33 / $55,843.58 |
Worked check for scenario B: \(D_1 = 100{,}000 \times 3.5/100 = 3{,}500\). Then \(\text{Total}_{\text{gross}} = 3{,}500 \cdot \frac{1.05^{10}-1}{0.05} = 3{,}500 \times 12.5779 = 44{,}022.62\), and \(\text{Total}_{\text{net}} = 44{,}022.62 \times 0.85 = 37{,}419.23\).
Note that scenario B pays less in year 1 than scenario C, but its growing payout narrows the gap over time. Even so, it still trails C in cumulative dividends over 10 years under these assumptions. These figures are illustrations of the formulas only and ignore price changes and reinvestment.
Key Terms: Yield, Distribution and Dividend Growth
- Trailing (TTM) yield: the distributions paid over the last 12 months divided by the current price. It describes the past.
- Forward yield: the most recent distribution, annualized (for example, a monthly payment × 12), divided by the current price. It assumes the current payout continues.
- Distribution yield: a fund's recent distributions annualized and divided by price. It may include income that is not strictly dividends, such as option premiums or return of capital.
- SEC yield: a standardized 30-day yield used by US-registered funds. It is based on net investment income after fund expenses and is meant to make funds comparable. It is specific to US SEC rules.
- Dividend growth rate: the annual percentage change in the dividend per share. This calculator applies one constant rate \(g\) each year after year 1.
- Qualified versus ordinary dividends: in the US tax system, qualified dividends meet holding-period and other requirements and are taxed at lower long-term capital gains rates. Ordinary (non-qualified) dividends are taxed at ordinary income rates. Other countries have different rules, so the tax rate field should reflect your own situation.
- Ex-dividend date: the first day a buyer of the shares is no longer entitled to the upcoming distribution. The share price typically drops by about the distribution amount on that date.
- Payout frequency: how often the fund distributes: monthly, quarterly, semi-annually or annually. The calculator divides the annual figure evenly into quarterly and monthly amounts.
- Total return: price change plus distributions, usually expressed as a percentage. Yield is only the income part of total return.
Yield is a ratio to price: \(y = \frac{\text{annual distribution per share}}{\text{share price}}\). The calculator treats the share price as constant, so the invested amount \(P\) stays fixed and the payout is simply \(P \cdot y/100\) in year 1.
Interpreting Your Estimated Payout
The result is a cash-flow estimate, not a forecast. It assumes the share price stays constant, no dividends are reinvested, and the yield you entered applies to the full amount invested in year 1, growing only at the single rate you specify.
Gross versus after-tax. The gross (pre-tax) figure is \(D_1 = P \cdot y/100\). The after-tax figure is \(D_{\text{net}} = D_1(1-\tau/100)\), which removes the tax rate you entered. It does not account for fund-level fees already netted out of the distribution, withholding on foreign dividends, or other taxes unless you include them in the rate. The same applies to cumulative totals: the after-tax total is the gross total times \((1-\tau/100)\).
Monthly and quarterly figures are averages. Many funds pay monthly or quarterly, and the individual amounts can differ from payment to payment. The calculator divides the annual amount by 12 or 4. Actual distributions vary with fund holdings, changes in the fund's payout policy, the timing of the ex-dividend dates and, for funds holding foreign assets or paying in another currency, exchange rates.
Yield on cost. Because the invested amount is fixed, the effective yield on cost in year \(n\) is \(\frac{D_n}{P} = \frac{y}{100}(1+g)^{n-1}\). For example, with \(P = 100{,}000\), \(y = 3.5\%\) and \(g = 5\%\), the year-10 payout is \(3{,}500 \times 1.05^{9} \approx 5{,}429.65\), or about 5.43% of the original amount. This is higher than the starting yield only because the payout grew, not because the share price changed.
In practice, price movements, distribution cuts, reinvestment and changes in tax law can all make real results differ from this estimate. This is general information, not tax or investment advice.
FAQ
Is a high yield always better?
No. A very high yield can signal a falling share price or an unsustainable payout, so check the fund holdings and history.
Are ETF dividends paid monthly?
It depends on the fund. Many pay quarterly, some monthly. The monthly and quarterly figures here are averages of the annual amount.
Does this include reinvestment?
No. Reinvesting dividends would buy more shares and increase later payouts, which this simple calculator does not model.