

What this tool does
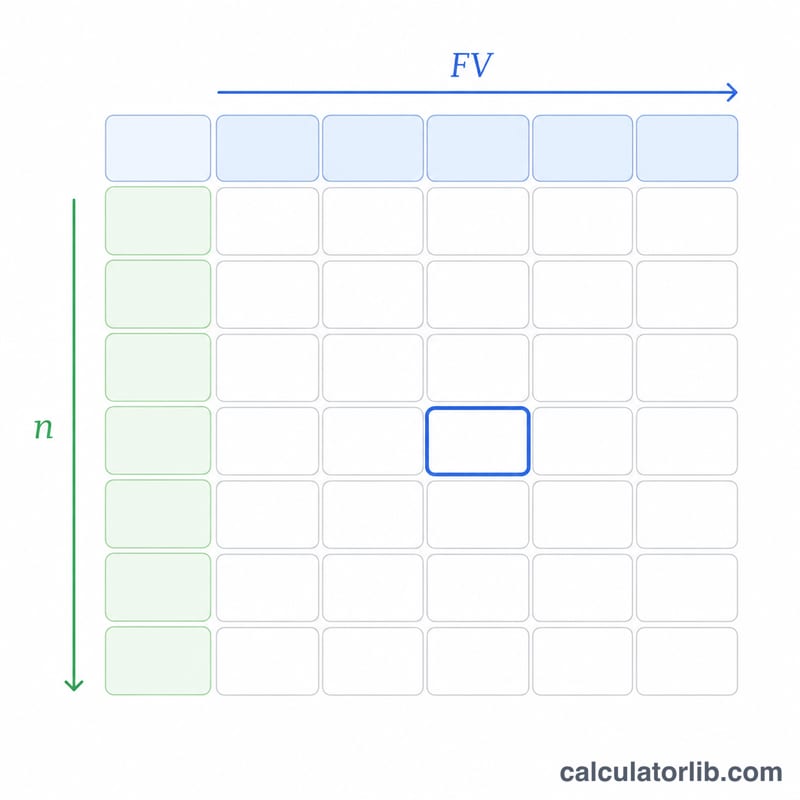
The Interest Rate on $1 Table Creator builds a grid showing the compound interest rate required for a single dollar (present value of $1) to grow into a range of target future values over a range of compounding periods. Each cell answers one question: "What constant per-period rate turns $1 into this Future Value in this many periods?" It is a pure financial-math tool that applies everywhere — there are no country-specific tax or banking rules involved.
How to use it
Set the number of Columns and the Starting Value plus its Increment to define the Future-Value headers across the top. Set the number of Rows, the Starting Period, and its Increment to define the period counts down the side. The table then fills every cell with the required rate as a percentage to four decimals.
The formula explained
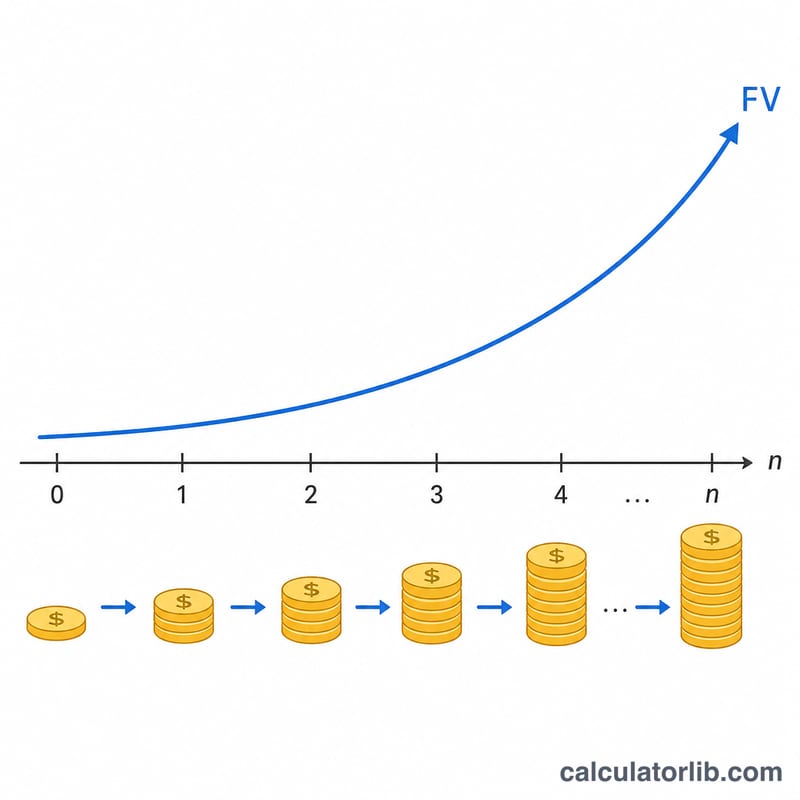
Compound growth follows $$FV = PV \times (1 + r)^n.$$ Because the present value is fixed at $1, the equation simplifies to $$r = FV^{1/n} - 1.$$ Multiplying by 100 gives the rate as a percentage: $$I = \left( FV^{1/n} - 1 \right) \times 100.$$ Here \(FV\) is the column's future value, \(n\) is the row's number of periods, and the exponent \(1/n\) is the reciprocal of the period count.
Worked example
For the default top-left cell, \(FV = \$2.00\) and \(n = 10\) periods: $$I = \left( 2^{1/10} - 1 \right) \times 100 = (1.0717734625 - 1) \times 100 \approx 7.1773\%.$$ With \(FV = \$2.50\) over 24 periods: $$I = \left( 2.5^{1/24} - 1 \right) \times 100 \approx 3.8917\%.$$ Lowering the rate or extending the period stretches the time needed to reach the same target.
FAQ
Why is the present value fixed at $1? Expressing everything per dollar makes the rate depend only on the ratio \(FV/\$1\), so any future value can be read as a simple multiple.
What if a future value is below $1? The math still works and returns a negative rate, representing required decline or a discount rate.
Are these annual rates? They are per-period rates. If your periods are years they are annual; if months, they are monthly — the unit is whatever you choose for \(n\).