What This Calculator Does
A table of values lists pairs of inputs and outputs for a function. When those values fall on a straight line, you can describe the entire relationship with one linear equation, \(y = mx + b\). This calculator takes any two distinct points from your table and produces the exact slope, y-intercept, and the finished equation.
How to Use It
Pick any two rows from your table and enter their coordinates as \((x_1, y_1)\) and \((x_2, y_2)\). The calculator divides the change in y by the change in x to get the slope, then uses one point to solve for the y-intercept. The result is shown in slope-intercept form, ready to graph or substitute.
The Formula Explained
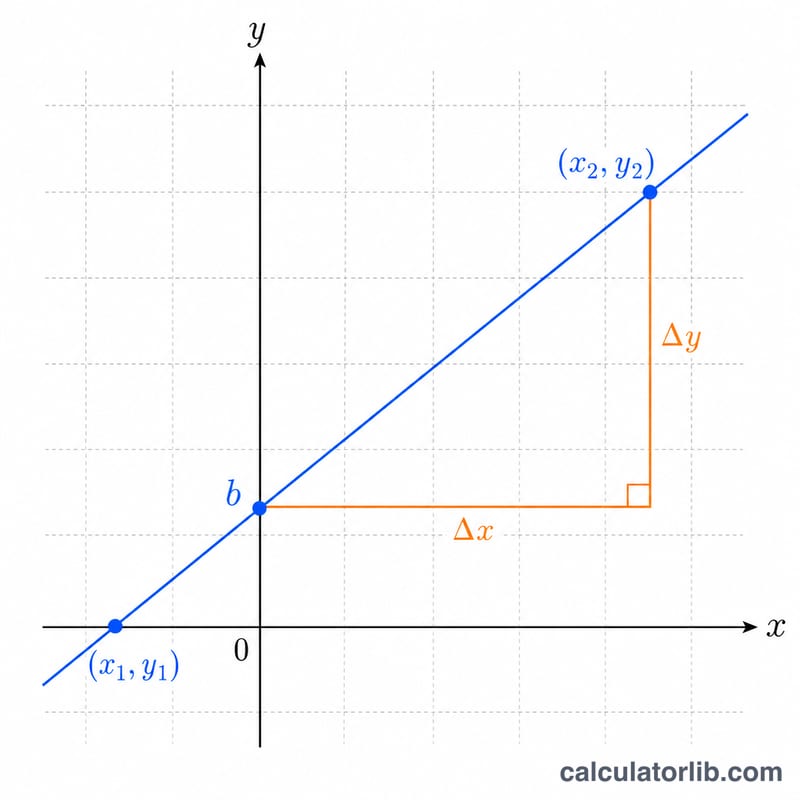
The slope m measures how much y changes for each one-unit increase in x: $$m = \frac{y_2 - y_1}{x_2 - x_1}$$ Once you know m, plug one point back into \(y = mx + b\) and solve for b: $$b = y_1 - m\cdot x_1$$ If both x-values are equal the line is vertical and has no slope, so the calculator reports \(x = \text{constant}\) instead.
Worked Example
Suppose your table gives the points \((1, 2)\) and \((3, 8)\). The slope is $$\frac{8 - 2}{3 - 1} = \frac{6}{2} = 3$$ Then \(b = 2 - 3\cdot 1 = -1\). The linear equation is \(y = 3x - 1\). Checking: at \(x = 3\), \(y = 3\cdot 3 - 1 = 8\). Correct.
FAQ
Which two points should I choose? Any two distinct rows work for a truly linear table; they all give the same line. Picking points with simple numbers makes mental checking easier.
What if my table is not perfectly linear? Then no single straight line fits all rows. This tool computes the exact line through the two points you enter; use a linear regression calculator for a best-fit line.
What does a slope of zero mean? A zero slope means y never changes — the line is horizontal and the equation is simply \(y = b\).


