
What is the Linear Regression (Least Squares) Calculator?
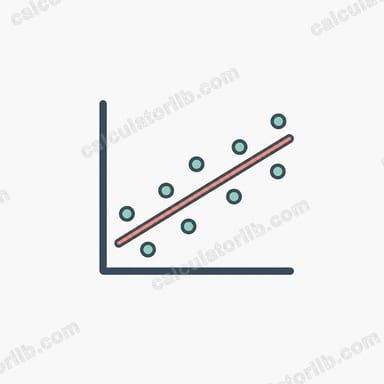
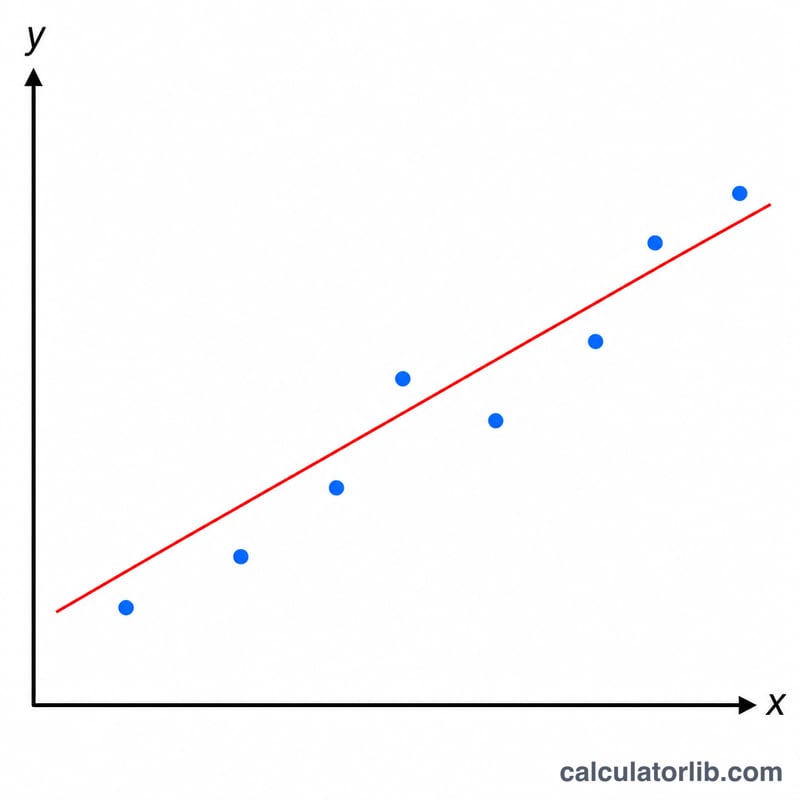
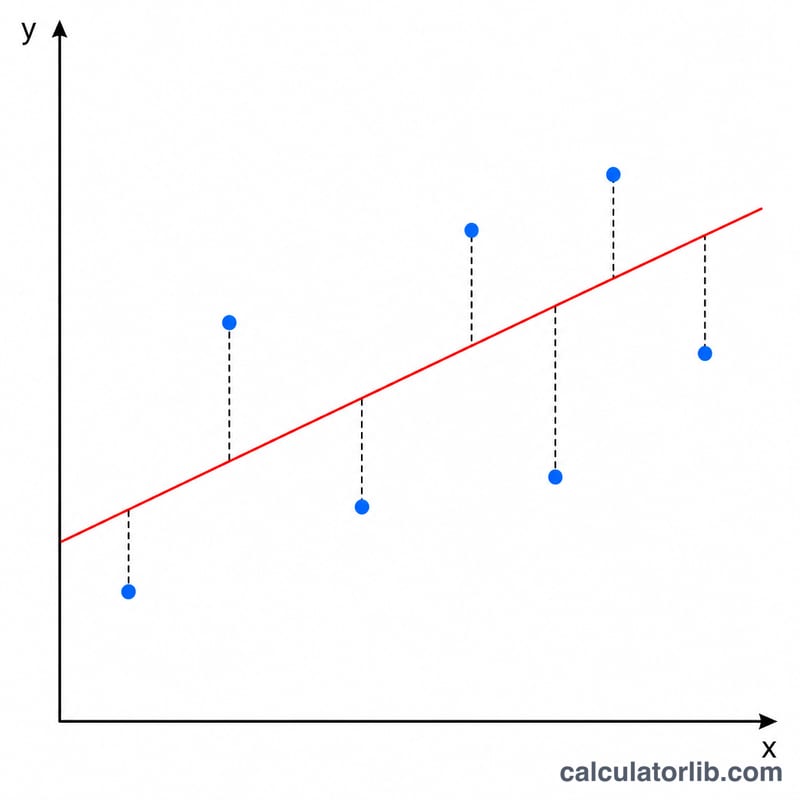
This tool fits the best straight line \(y = A + B \cdot x\) through a set of (x, y) data points using ordinary least squares (OLS). It returns the slope B, the intercept A, the means of x and y, the sums of squares, the fitted equation, and the Pearson correlation coefficient r — together with a quick verbal guide to how strong that correlation is.
How to use it
Enter one (x, y) pair per line in the data box, separated by a comma or space — for example 1, 2. Blank or incomplete lines and non-numeric cells are ignored. You need at least two valid pairs for a line to be defined. Pick how many significant digits to display (this only changes formatting, not the math), then read off the slope, intercept and r.
The formula explained
With n valid pairs, compute the means \(\bar{x} = \sum x_i / n\) and \(\bar{y} = \sum y_i / n\). Then the sums of squares and cross-products: \(S_{xx} = \sum x_i^2 - n \cdot \bar{x}^2\), \(S_{yy} = \sum y_i^2 - n \cdot \bar{y}^2\), \(S_{xy} = \sum x_i y_i - n \cdot \bar{x} \cdot \bar{y}\). The slope is \(B = S_{xy}/S_{xx}\), the intercept \(A = \bar{y} - B \cdot \bar{x}\), and the correlation coefficient \(r = S_{xy} / (\sqrt{S_{xx}} \cdot \sqrt{S_{yy}})\). If all x values are identical (\(S_{xx} = 0\)), no non-vertical line can be fit. If \(S_{yy} = 0\), r is undefined and is reported as 0.
Worked example
Data: (1,2), (2,4), (3,5), (4,4), (5,5), n = 5. Σx = 15, Σy = 20 → xBar = 3, yBar = 4. Σx² = 55 → Sxx = 55 − 45 = 10. Σy² = 86 → Syy = 86 − 80 = 6. Σxy = 66 → Sxy = 66 − 60 = 6. Slope B = 6/10 = 0.6, intercept A = 4 − 0.6·3 = 2.2, and r = 6/√60 ≈ 0.7746 (strong). Fitted line: $$y = 2.2 + 0.6 \cdot x$$
FAQ
What does r mean? r is the Pearson correlation coefficient, ranging from −1 to +1. Values near ±1 indicate a strong linear relationship; near 0 means little or no linear relationship. As a guide: |r| > 0.7 strong, 0.4–0.7 moderate, 0.2–0.4 weak, below 0.2 none.
What if my points are all vertical? If every x is the same, \(S_{xx} = 0\) and a least-squares line cannot be fit — the calculator reports an error.
Does the display-digits option change the answer? No. It only controls how many significant figures are shown; the regression is always computed at full precision.