What Is Maximum Drawdown?
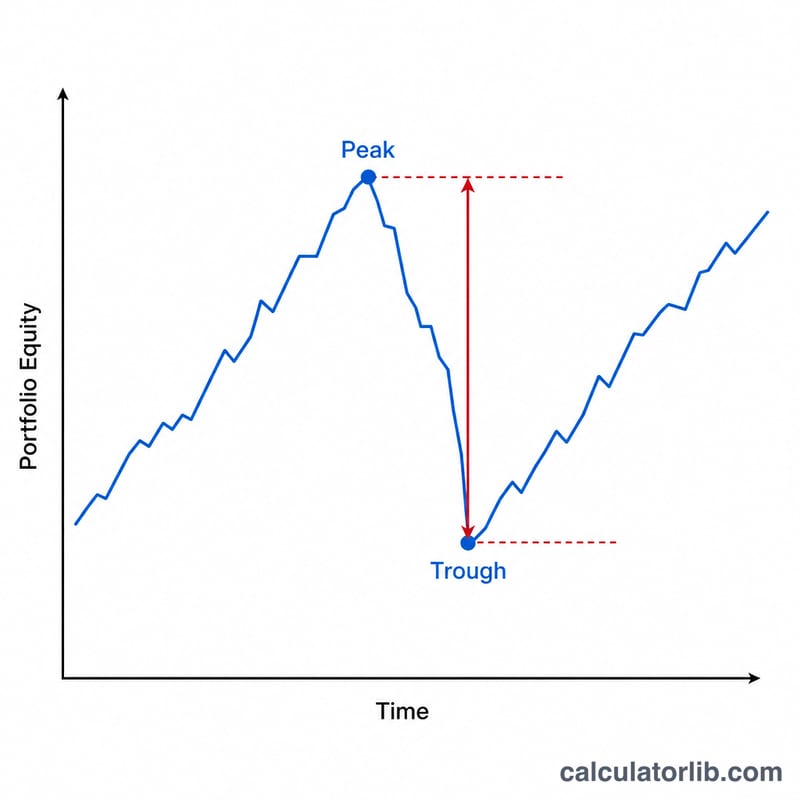
Maximum drawdown (MDD) measures the largest observed loss from a peak to a subsequent trough of an investment, portfolio, or fund before a new peak is reached. It is one of the most widely used risk metrics because it captures downside risk in a way investors intuitively understand: "how much could I have lost from the top?" A lower maximum drawdown generally indicates a less volatile, less risky investment.
How to Use This Calculator
Enter the highest value your portfolio reached (the peak) and the lowest value it fell to afterward (the trough). The calculator instantly returns the drawdown as a percentage of the peak, along with the absolute loss amount. Use account statement highs and lows, or pull the values from a price chart.
The Formula Explained
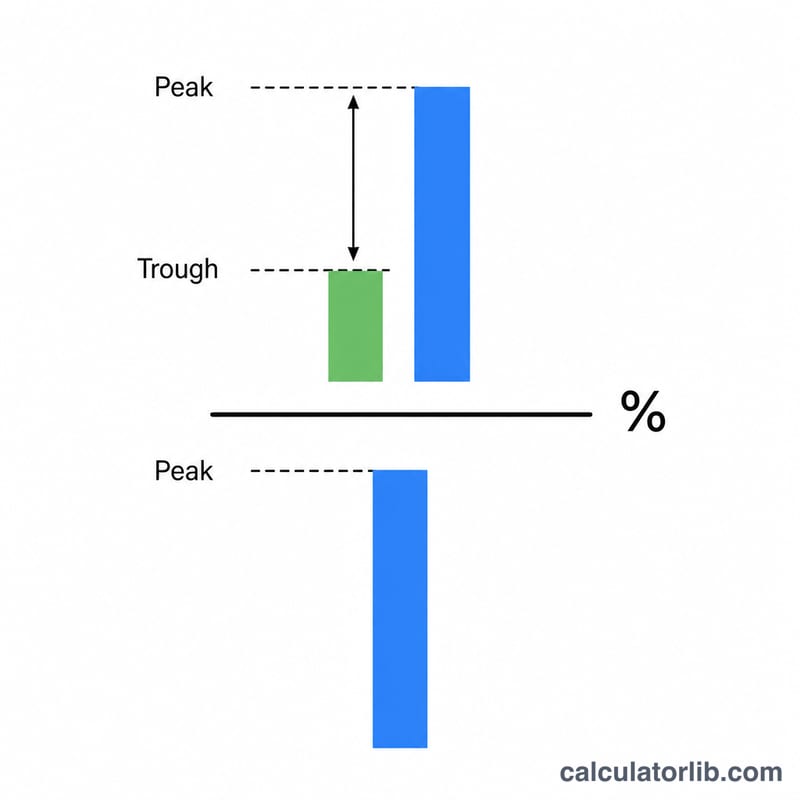
The maximum drawdown is calculated as:
$$\text{MDD} = \frac{\text{Peak} - \text{Trough}}{\text{Peak}} \times 100\%$$
The numerator is the dollar (or unit) loss, and dividing by the peak normalizes it so drawdowns of different sizes can be compared. The result is always expressed as a percentage of the high-water mark.
Worked Example
Suppose your portfolio peaked at $10,000 and later dropped to a low of $7,500. The drawdown amount is \(\$10{,}000 - \$7{,}500 = \$2{,}500\). As a percentage: $$\$2{,}500 \div \$10{,}000 \times 100 = 25\%$$ That means you experienced a 25% maximum drawdown — your portfolio would need to gain 33.3% from the trough just to return to its old peak.
FAQ
Is a higher or lower drawdown better? Lower is better. A smaller maximum drawdown means the investment lost less value at its worst point.
How is drawdown different from volatility? Volatility measures overall fluctuation in both directions, while drawdown focuses only on the worst peak-to-trough decline — pure downside risk.
Why does recovery require a bigger gain than the drawdown? Because the gain is calculated off the lower trough value. A 25% loss needs a 33% gain to break even, since \(7{,}500 \times 1.333 \approx 10{,}000\).