What Is Relative Standard Deviation?
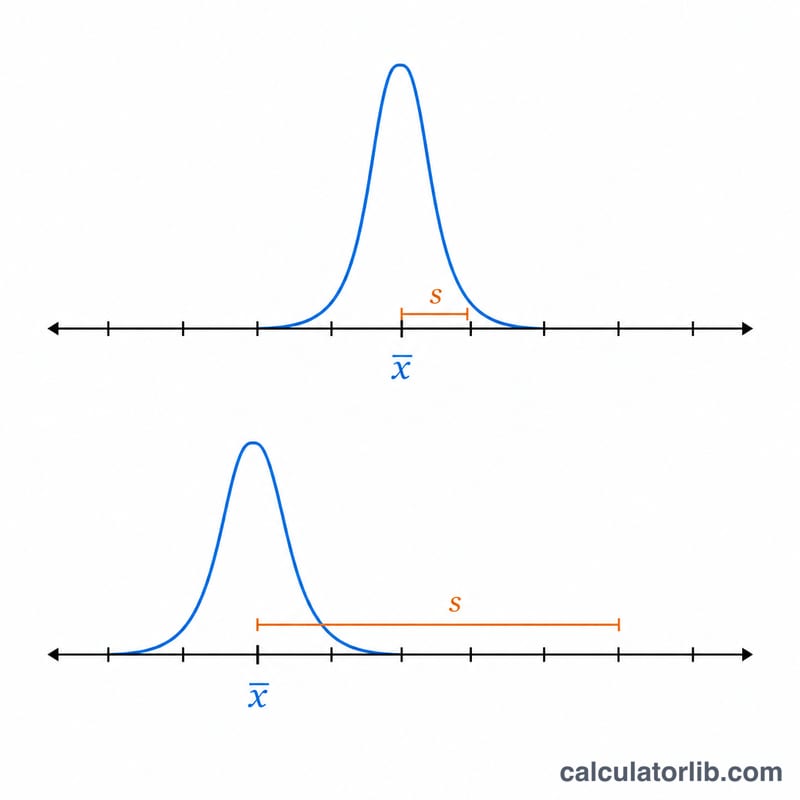
The relative standard deviation (RSD), also known as the coefficient of variation (%CV), measures how spread out a set of values is relative to its average. Because it divides the standard deviation by the mean and multiplies by 100, the result is a dimensionless percentage. This makes RSD ideal for comparing the precision of measurements that have different units or very different magnitudes — something a raw standard deviation cannot do.
How to Use This Calculator
Enter your data values separated by commas or spaces. Choose whether you want a sample standard deviation (uses n−1, the usual choice when your data is a subset of a larger group) or a population standard deviation (uses n, when your data represents the entire group). The calculator returns the RSD as a percentage along with the mean, standard deviation, and the number of data points.
The Formula Explained
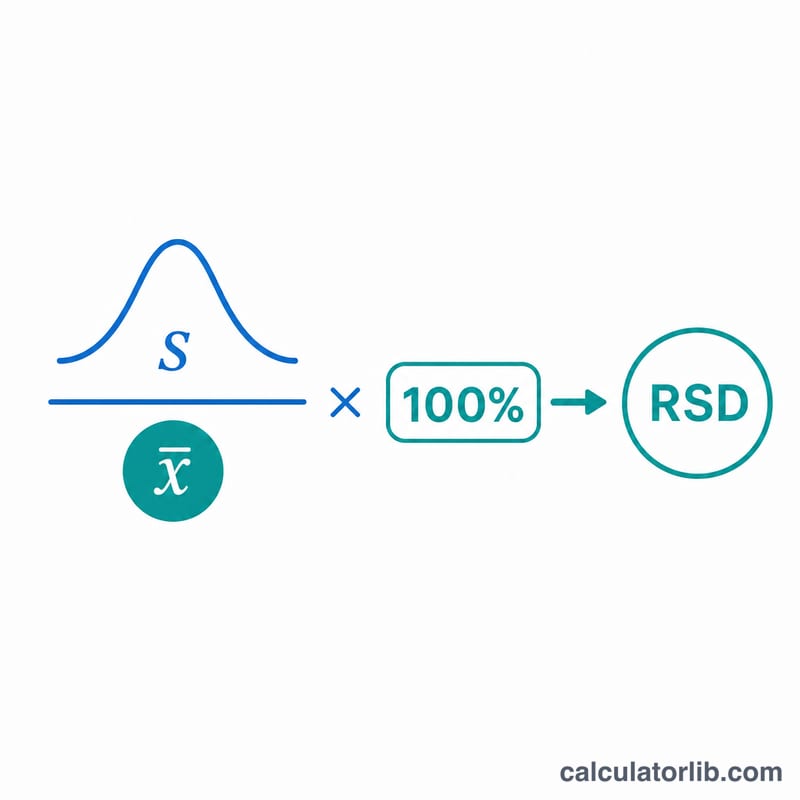
First the mean (\(\bar{x}\)) is calculated. Then the standard deviation (\(s\)) is found from the squared deviations about the mean. Finally $$\text{RSD} = \frac{s}{\bar{x}} \times 100\%$$ A small RSD (under ~10%) indicates tightly clustered, precise data; a large RSD signals high variability.
Worked Example
For the data set 10, 12, 14, 16, 18: the mean is 14. The sample variance is $$\frac{(-4)^2+(-2)^2+0^2+2^2+4^2}{4} = \frac{40}{4} = 10,$$ so \(s = \sqrt{10} \approx 3.1623\). $$\text{RSD} = \frac{3.1623}{14} \times 100 \approx 22.59\%.$$
RSD Across Example Data Sets
Every row below uses the sample standard deviation (the \(n-1\) denominator), the same convention as the worked example, so the numbers can be reproduced directly in the calculator with the sample option selected. The point of the comparison is that RSD is a ratio: the same spread can be excellent precision or terrible precision depending on where the mean sits.
| Data values | n | Mean \(\bar{x}\) | Sample SD \(s\) | RSD (%CV) |
|---|---|---|---|---|
| 8, 10, 12 | 3 | 10 | 2.0000 | 20.00% |
| 98, 100, 102 | 3 | 100 | 2.0000 | 2.00% |
| 10.02, 9.98, 10.01 | 3 | 10.0033 | 0.0208 | 0.21% |
| 5, 15, 25, 35 | 4 | 20 | 12.9099 | 64.55% |
| 20, 21, 22, 23, 24 | 5 | 22 | 1.5811 | 7.19% |
| 20, 21, 22, 23, 60 (last value is an outlier) | 5 | 29.2 | 17.2540 | 59.09% |
How the first row is obtained
Full substitution for the set 8, 10, 12:
$$\bar{x} = \frac{8 + 10 + 12}{3} = \frac{30}{3} = 10$$$$s = \sqrt{\frac{(8-10)^2 + (10-10)^2 + (12-10)^2}{3-1}} = \sqrt{\frac{4 + 0 + 4}{2}} = \sqrt{4} = 2$$$$\text{RSD} = \frac{2}{10} \times 100\% = 20\%$$What the rows show
- Identical SD, tenfold difference in RSD (rows 1 and 2). Both sets are three points spaced two units apart, so both give \(s = 2\) exactly. Because the means are 10 and 100, the RSD is 20% versus 2%. A standard deviation alone cannot tell you whether a measurement is precise; it has to be read against the magnitude of what was measured.
- A tightly clustered replicate set (row 3). Three replicate determinations near 10 units differ by at most 0.04, giving an RSD of about 0.21% — the kind of repeatability expected from replicate injections on a well-behaved chromatographic system.
- A genuinely variable set (row 4). With values from 5 to 35 around a mean of 20, the RSD of roughly 65% says the spread is of the same order as the mean itself. For an analytical replicate set this would signal a failed method; for between-individual biological data it may be entirely normal.
- The inflating effect of one outlier (rows 5 and 6). Replacing the single value 24 with 60 leaves four of the five observations untouched, yet the mean rises from 22 to 29.2, the SD rises more than tenfold, and the RSD jumps from about 7% to about 59%. Because squared deviations are summed, one extreme point dominates the result — which is why an unexpectedly large RSD should prompt you to inspect the raw values before concluding the process is imprecise.
Two practical cautions follow from the table. First, an RSD computed from only three points is itself an imprecise estimate, so small differences between such values should not be over-interpreted. Second, if you switch the calculator to the population standard deviation (dividing by \(n\) instead of \(n-1\)), every RSD above becomes smaller — for \(n = 3\) by a factor of \(\sqrt{2/3} \approx 0.816\) — so always state which convention a reported %CV uses before comparing it with an acceptance criterion.
Conventions and edge cases
Each case below was run through this calculator; the result column is what it actually returns.
| Case | Input | Result |
|---|---|---|
| Decimals 0.1, 0.2, 0.3 | 0.1, 0.2, 0.3 | 50% |
| Even number of values (1, 2, 3, 4) | 1, 2, 3, 4 | 51.64% |
| Negative values (−3, −1, 4) | -3, -1, 4 | The relative standard deviation is not defined when the mean is 0. |
| A zero in the list (0, 4, 9) | 0, 4, 9 | 104.06% |
| Sample or population (2, 4, 4, 4, 5, 5, 7, 9) | 2, 4, 4, 4, 5, 5, 7, 9 | 42.76% |
| A single value | 7 | A sample standard deviation needs at least 2 values. |
Checked on 2026-11-08
FAQ
Is RSD the same as %CV? Yes — relative standard deviation and the percent coefficient of variation refer to the same calculation.
Should I use sample or population? Use sample (n−1) when your values are a sample drawn from a bigger population, which covers most lab and survey scenarios. Use population (n) only when you have measured every member of the group.
What is a good RSD? It depends on the field. In analytical chemistry an RSD below 2% is often considered excellent precision, while in other contexts up to 15–20% may be acceptable.