
What Is Sales Per Labor Hour?
Sales per labor hour — known in Japanese restaurant management as ninji-uriagedaka — measures the average revenue a business generates for every single hour of employee labor. It is a core productivity KPI for restaurants, cafes and retail, but because the math is simply revenue divided by hours, it works in any country and any currency. Enter your figures in your local currency; the result comes back in that same currency, per labor hour.
How to Use the Calculator
Enter two values: your Monthly Sales (Revenue) and your Monthly Total Labor Hours. The total labor hours must include every working hour for the period — full-time staff regular hours, full-time overtime, and all part-time or casual ("arubaito") hours. Sum them before entering. The calculator divides sales by hours to give the headline figure.
The Formula Explained
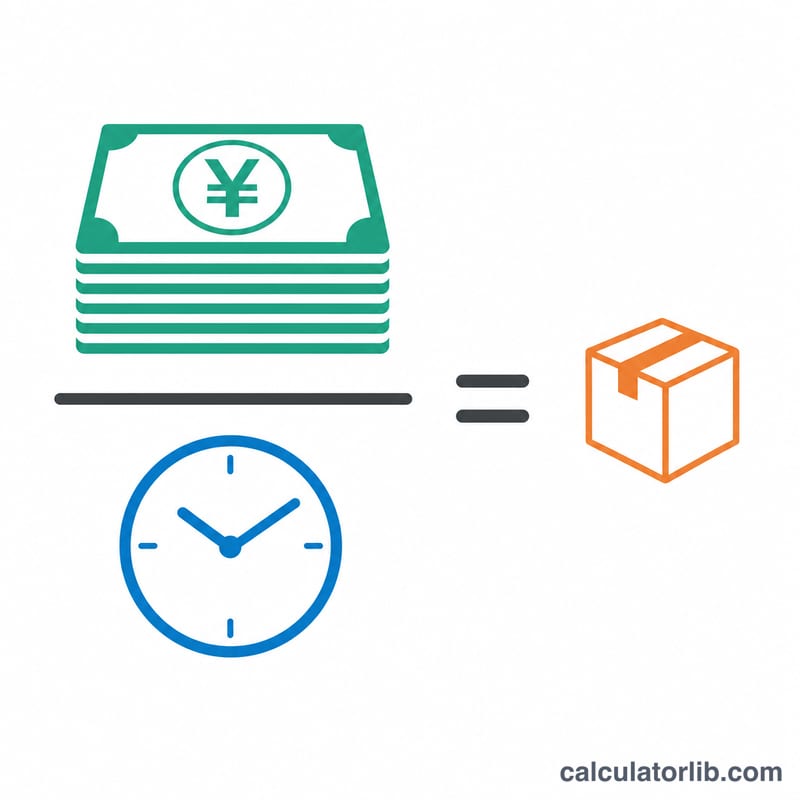
The equation is: $$\text{Sales Per Labor Hour} = \frac{\text{Monthly Sales}}{\text{Monthly Total Labor Hours}}$$ No unit conversion is needed — currency passes through unchanged and time is already expressed in hours. The only guard is that total labor hours must be greater than zero, otherwise the division is undefined.
Worked Example
Suppose a restaurant records 5,000,000 in monthly sales and logs 1,250 total labor hours across all staff. The calculation is $$5{,}000{,}000 \div 1{,}250 = 4{,}000$$ So the store generates 4,000 currency units of revenue per labor hour. A second example: 8,400,000 in sales over 1,400 hours gives $$8{,}400{,}000 \div 1{,}400 = 6{,}000$$ per labor hour.
Interpreting Your Sales Per Labor Hour Result
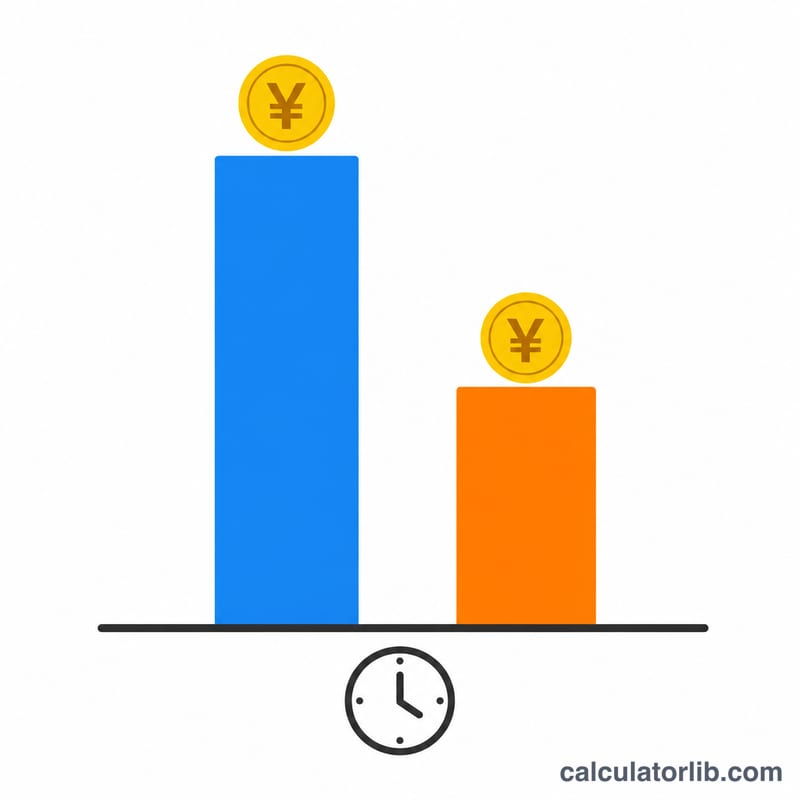
Sales per labor hour (ninji-uriagedaka) is a productivity ratio: how much revenue each employee-hour produced. The number has no meaning on its own, because it depends heavily on menu price level, service style (counter service, casual dining, full service), and opening hours. A late-night bar and a lunch-focused noodle shop will naturally produce very different figures.
What a trend signals
- Rising: sales are growing faster than hours. This may mean good productivity, but if it continues while service quality drops, the team may be too lean.
- Falling: hours are growing faster than sales. Possible causes are overstaffing, long prep or idle periods, or a drop in customer demand (season, weather, local events, competition) without matching schedule changes.
Relation to labor cost percentage
If you know the average hourly wage, you can estimate the labor cost ratio:
$$\text{Labor cost ratio} = \frac{\text{hourly wage}}{\text{sales per labor hour}} \times 100\%$$
Illustration: with an average hourly labor cost of 1,200 and sales per labor hour of 4,000, the ratio is \(1{,}200 \div 4{,}000 \times 100 = 30\%\). If sales per labor hour rise to 4,400, it becomes \(1{,}200 \div 4{,}400 \times 100 \approx 27.3\%\). Use a wage figure that includes the costs you want to count (for example, employer-paid contributions) and apply it consistently.
How to use it
- Compare against your own store's target and your own past periods (same month last year, previous month) rather than outside figures.
- Peak and off-peak hours differ greatly. A monthly average can hide overstaffed slow periods and understaffed rushes, so check by daypart or day of week as well.
- Treat it as an internal management metric, not a universal benchmark; ideal levels vary by concept, location, and strategy.
Scenario Comparison: Sales vs. Labor Hours
The baseline is monthly sales of 5,000,000 (in your currency, for example yen) and 1,250 labor hours. Each row changes one factor at a time, except the last two, where both factors move.
| Scenario | Monthly sales | Labor hours | Sales per labor hour | Change vs. baseline |
|---|---|---|---|---|
| Baseline | 5,000,000 | 1,250 | 4,000 | 0% |
| Sales +10%, same hours | 5,500,000 | 1,250 | 4,400 | +10.0% |
| Same sales, hours cut 10% | 5,000,000 | 1,125 | 4,444.4 | +11.1% |
| Sales -10%, same hours | 4,500,000 | 1,250 | 3,600 | -10.0% |
| Sales +10%, hours +10% | 5,500,000 | 1,375 | 4,000 | 0% |
| Sales +10%, hours +4% | 5,500,000 | 1,300 | 4,230.8 | +5.8% |
Takeaways
- Cutting hours by 10% raises the ratio by about 11.1%, slightly more than a 10% sales gain, because hours are the denominator (\(1/0.9 \approx 1.111\)).
- A 10% sales drop with unchanged hours lowers the ratio by exactly 10%.
- If hours grow in step with sales, the ratio does not move. Productivity only improves when sales grow faster than hours.
- Cutting hours is not automatically good: if service speed or quality suffers, sales may fall and offset the gain.
FAQ
What is a good sales-per-labor-hour value? There is no universal target — each store sets its own ideal based on its menu prices and staffing model. The closer a manager brings the actual figure to the store's target, the better the labor productivity. It is often described as a measure of the store manager's operational skill.
Which hours should I include? All paid working hours: full-time regular hours, full-time overtime, and every part-time and casual hour. Leaving any out will overstate your productivity.
Does the currency matter? No. The metric is currency-agnostic; the result is simply in whatever currency you used for sales, expressed per hour.