
What this calculator does
Jurisdiction: United States. This tool estimates US federal individual income tax owed on a given amount of taxable income using the IRS progressive marginal rate schedules for the tax year and filing status you choose (2019 through 2026). It reports your estimated tax, your top marginal bracket, your effective tax rate, and your net income after tax. Non-US readers: this models US federal income tax only and has no equivalent elsewhere.
Important: taxable income only
You must enter income after deductions and exemptions. This calculator does NOT apply the standard deduction, itemized deductions, tax credits, the Alternative Minimum Tax (AMT), the Net Investment Income Tax, self-employment tax, FICA (Social Security/Medicare), or any state or local tax. It is a clean estimate of tax on the taxable base only.
How to use it
1) Pick the tax year. 2) Pick your filing status (Single, Married Filing Jointly, Married Filing Separately, or Head of Household). 3) Enter your taxable income in dollars. Press calculate to see the breakdown.
The formula explained
The US uses a progressive system: income is sliced into brackets, and each slice is taxed at that bracket's marginal rate. All four filing statuses share the same seven rates (10%, 12%, 22%, 24%, 32%, 35%, 37%); only the dollar thresholds differ by year and status. Your tax is the sum of (rate x portion of income falling inside each bracket). Bracket boundaries are lower-inclusive and upper-exclusive, so income exactly at a threshold falls into the higher bracket.
$$\text{Tax} = \sum_r \text{rate}_r \times \big(\min(\text{income}, U_r) - L_r\big)$$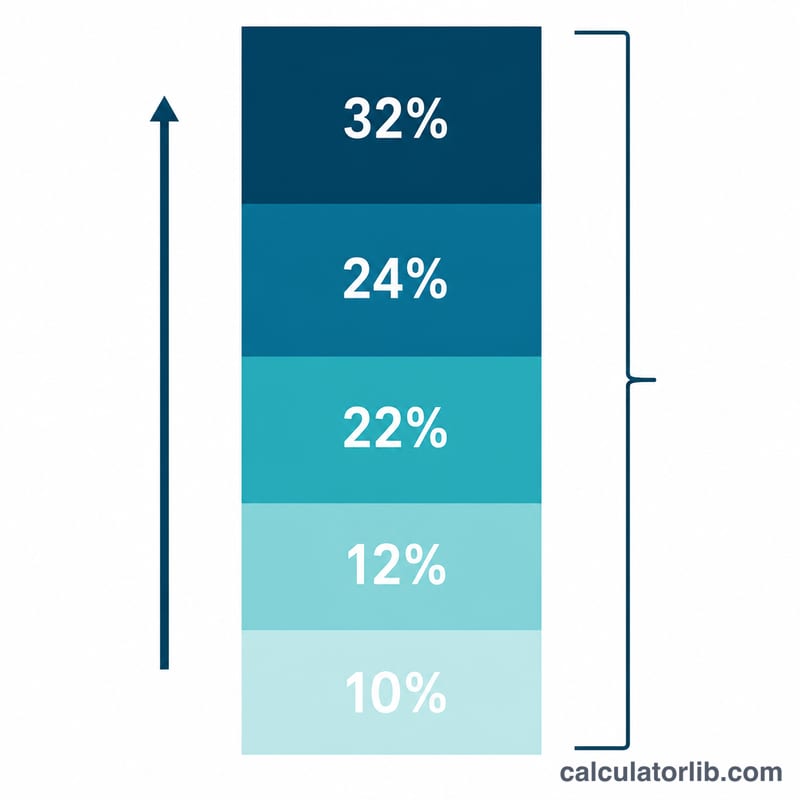
Worked example
Tax year 2026, Married Filing Jointly, taxable income $85,000. The 10% bracket covers [0, 24800): \(0.10 \times 24{,}800 = \$2{,}480\). The 12% bracket covers [24800, 100800), and your income stops at 85,000:
$$0.12 \times (85{,}000 - 24{,}800) = 0.12 \times 60{,}200 = \$7{,}224$$Total tax = \(2{,}480 + 7{,}224 = \) $9,704. Marginal bracket = 12.0%. Effective rate = \(9{,}704 / 85{,}000 \times 100 = 11.42\%\). Net income = \(85{,}000 - 9{,}704 = \$75{,}296\).
2026 Federal Income Tax Brackets by Filing Status
These are the US federal (IRS) ordinary income tax brackets for tax year 2026, applied to taxable income (income after deductions). They apply only to US federal income tax, not to state taxes or other countries' systems. Each cell shows the taxable-income range taxed at that rate.
| Rate | Single | Married Filing Jointly | Married Filing Separately | Head of Household |
|---|---|---|---|---|
| 10% | $0 – $12,400 | $0 – $24,800 | $0 – $12,400 | $0 – $17,700 |
| 12% | $12,400 – $50,400 | $24,800 – $100,800 | $12,400 – $50,400 | $17,700 – $67,450 |
| 22% | $50,400 – $105,700 | $100,800 – $211,400 | $50,400 – $105,700 | $67,450 – $105,700 |
| 24% | $105,700 – $201,775 | $211,400 – $403,550 | $105,700 – $201,775 | $105,700 – $201,750 |
| 32% | $201,775 – $256,225 | $403,550 – $512,450 | $201,775 – $256,225 | $201,750 – $256,200 |
| 35% | $256,225 – $640,600 | $512,450 – $768,700 | $256,225 – $384,350 | $256,200 – $640,600 |
| 37% | Over $640,600 | Over $768,700 | Over $384,350 | Over $640,600 |
Thresholds for tax years 2019 through 2025 are available in the calculator's tax year selector. These brackets cover ordinary income only; long-term capital gains and qualified dividends are taxed under separate rates.
Key Tax Terms Explained
- Taxable income
- The amount of income on which US federal income tax is actually computed: adjusted gross income minus the standard deduction or itemized deductions (and certain other deductions). This is the input the calculator uses.
- Adjusted gross income (AGI)
- Total income (wages, interest, business income, etc.) minus specific "above-the-line" adjustments such as certain retirement contributions or student loan interest. AGI comes before the standard or itemized deduction.
- Standard deduction
- A fixed amount, set by filing status and adjusted for inflation each year, that reduces AGI when you do not itemize. For 2026 it is $16,100 for single filers, $32,200 for married filing jointly, and $24,150 for head of household.
- Marginal tax rate
- The rate applied to the last dollar of taxable income, i.e. the rate of the highest bracket your income reaches.
- Effective tax rate
- Total tax divided by taxable income. It is an average rate across all brackets, so it is lower than the marginal rate once income exceeds the first bracket.
- Filing status
- The category you file under: single, married filing jointly, married filing separately, or head of household. It determines bracket thresholds and the standard deduction.
- Progressive tax
- A system in which higher slices of income are taxed at higher rates, rather than one rate applying to all income.
- Tax bracket threshold
- The taxable-income dollar amount at which one bracket ends and the next, higher-rate bracket begins. Thresholds are indexed to inflation annually.
Interpreting Your Result
- Estimated tax: the sum of the tax on each slice of taxable income at its bracket rate, for the selected year and filing status.
- Marginal bracket: the rate on your highest slice of income. It describes the tax on the next dollar earned, not on all your income.
- Effective rate: estimated tax divided by taxable income. Because lower slices are taxed at lower rates, it is below the marginal rate whenever income extends beyond the 10% bracket.
- Net income: taxable income minus the estimated federal income tax. Note that this starts from taxable income, not gross pay.
Moving into a higher bracket does not raise the tax on all your income. Only the portion above the threshold is taxed at the higher rate.
Example (2026, single filer, $60,000 taxable income)
Tax = 10% × $12,400 + 12% × ($50,400 − $12,400) + 22% × ($60,000 − $50,400)
= $1,240 + $4,560 + $2,112 = $7,912
The marginal bracket is 22%, while the effective rate is $7,912 ÷ $60,000 ≈ 13.19%. Net income is $60,000 − $7,912 = $52,088.
This estimate covers only US federal income tax on ordinary taxable income. It excludes payroll taxes (Social Security and Medicare), tax credits, the alternative minimum tax, other federal taxes, and state or local taxes. It is general information, not tax advice.
Income and jobs: United States
Average income and unemployment in United States compared with the world, from the World Bank: a benchmark for the figures you enter above.
- GNI per capita 2025
- 88,810 USD
- GDP per capita, PPP 2025
- 90,027 intl. $
- World: 25,704
- Unemployment 2025
- 4.2%
- World: 4.8%
Latest change Up +7.1% 2025: 88,810 USD, against 82,910 USD in 2024. CalculatorLib computes this change from the two published figures.
In 2025, gross national income per person in United States was 88,810 US dollars a year, about 7,401 US dollars a month. World: 14,244 USD
| Year | GNI per capita (USD) | GDP per capita, PPP (intl. $) | Unemployment |
|---|---|---|---|
| 2025 | 88,810 | 90,027 | 4.2% |
| 2024 | 82,910 | 86,170 | 4.0% |
| 2023 | 79,950 | 82,587 | 3.6% |
| 2022 | 77,230 | 78,009 | 3.7% |
| 2021 | 71,510 | 71,441 | 5.3% |
| 2020 | 64,630 | 64,465 | 8.1% |
| 2019 | 65,840 | 65,228 | 3.7% |
| 2018 | 63,040 | 62,876 | 3.9% |
| 2017 | 58,860 | 60,048 | 4.4% |
| 2016 | 56,830 | 57,977 | 4.9% |
GNI per capita (Atlas method) is the average of all income in the economy, not a typical salary; PPP dollars adjust for local prices.
Income tax and social security: United States
- Top income tax rate 2025
- 43.65%
- from 8.7 × the average wage
- Employee social security 2025
- 7.65% · 1.45%
In 2025, the top statutory personal income tax rate in United States (central and local government combined) was 43.65%. It applies from 8.7 times the average wage of 73,520 USD, that is from about 642,101 USD a year.
Employee social security contribution rates for successive earnings bands, lowest band first; the band limits are not shown.
Top income tax rates in OECD countries
| Country | Top rate | Applies from (× average wage) | Year |
|---|---|---|---|
| Japan | 55.95% | 7.7 | 2025 |
| France | 55.37% | 12.9 | 2025 |
| South Korea | 49.5% | 19.0 | 2025 |
| Germany | 47.48% | 4.4 | 2025 |
| United Kingdom | 45% | 2.2 | 2025 |
| United States | 43.65% | 8.7 | 2025 |
| Türkiye | 40.76% | 5.6 | 2025 |
| Mexico | 35% | 20.6 | 2025 |
The top rate is the statutory rate on the highest earnings, not the rate most workers pay. OECD figures cover OECD member countries only.
United States and other countries
GNI per capita in current US dollars (Atlas method) — each country’s latest published year.
- United States 88,810 USD (2025)
- France 48,630 USD (2025)
- Japan 38,340 USD (2025)
- South Korea 37,880 USD (2025)
- Saudi Arabia 36,070 USD (2025)
- Türkiye 16,300 USD (2025)
- Russia 15,960 USD (2025)
- World 14,244 USD (2025)
- China 14,230 USD (2025)
- Mexico 13,730 USD (2025)
- Vietnam 4,970 USD (2025)
- India 2,760 USD (2025)
No published figure yet for Taiwan.
Years can differ between rows: each figure is shown with its own year. The same World Bank indicator for every country.
Latest figure: 2025 Data last updated 2026-10-18 · current
Source: The World Bank Group CC BY 4.0; OECD, Tax Database CC BY 4.0
Monthly figures are computed by CalculatorLib from these data. The top-rate threshold in national currency (multiple × average wage) is computed by CalculatorLib from these data.
Source details and methodology
- The World Bank Group — World Development Indicators (NY.GNP.PCAP.CD, NY.GDP.PCAP.PP.CD, SL.UEM.TOTL.ZS)
- OECD, Tax Database — Top statutory personal income tax rate; employee social security contribution rates
FAQ
Why is my marginal rate higher than my effective rate? The marginal rate applies only to your last dollar; lower brackets tax earlier dollars at lower rates, so your overall (effective) rate is always lower than your top bracket.
The effective rate is computed as $$\text{Effective Rate} = \frac{\text{Estimated Tax}}{\text{Taxable Income}} \times 100$$
Does this include the standard deduction? No. Enter income already reduced by your deduction. For 2026 the standard deduction is about $16,100 (Single) and $32,200 (Married Filing Jointly), but you subtract that yourself before entering taxable income.
How accurate is the 2026 table? The 2026 thresholds are the IRS inflation-adjusted figures from Revenue Procedure 2025-32; all years estimate federal income tax only.