What Is the 28/36 Rule?
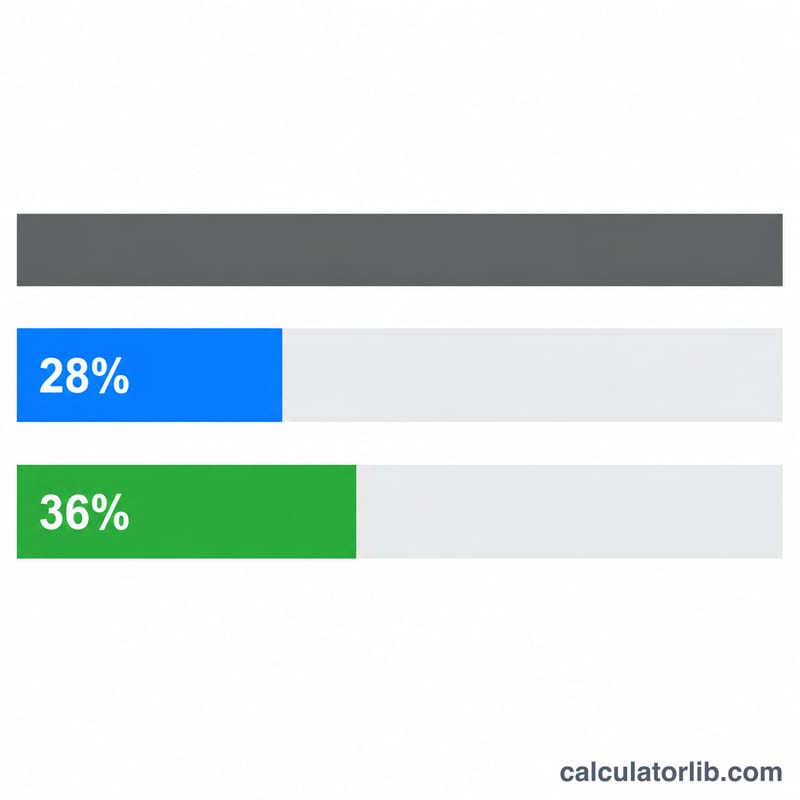
The 28/36 rule is a widely used guideline in personal finance and mortgage lending that helps you judge how much house you can comfortably afford. It states that you should spend no more than 28% of your gross monthly income on housing costs (the "front-end" ratio), and no more than 36% of your gross monthly income on total debt payments including housing (the "back-end" ratio).
How to Use This Calculator
Enter your gross monthly income (your income before taxes) and your existing monthly debt payments such as car loans, student loans, and minimum credit card payments. The calculator returns your 28% housing limit, your 36% total debt limit, and a recommended maximum housing payment — the smaller of the 28% limit and the amount left after subtracting your other debts from the 36% limit.
The Formula Explained
Two simple multiplications drive the rule:
$$\text{Max Housing} = 0.28 \times \text{Gross Monthly Income}$$
$$\text{Max Total Debt} = 0.36 \times \text{Gross Monthly Income}$$
Because the back-end limit covers all debt, the room available for housing is the back-end limit minus your existing debts. Lenders generally want both ratios satisfied, so the recommended figure is whichever housing amount is lower.
Worked Example
Suppose your gross monthly income is $6,000 and you have $500 in existing monthly debt. Your front-end limit is $$0.28 \times 6{,}000 = \$1{,}680$$ Your back-end limit is $$0.36 \times 6{,}000 = \$2{,}160$$ After your $500 of other debt, $$\$2{,}160 - \$500 = \$1{,}660$$ remains for housing. Since $1,660 is lower than $1,680, your recommended maximum housing payment is $1,660 per month.
Affordability Across Income Levels
The 28/36 rule sets two ceilings. The front-end limit is 28% of gross monthly income, the most that should go toward housing (principal, interest, taxes and insurance). The back-end limit is 36% of gross income for all debt combined, so the room left for housing after existing debt payments is \(0.36 \times \text{Income} - \text{Debts}\). Your recommended maximum housing payment is the smaller of the two:
$$\text{Housing Budget} = \min\!\left(0.28 \times \text{Income},\; 0.36 \times \text{Income} - \text{Debts}\right)$$
The table below applies this to several realistic gross monthly incomes and existing monthly debt loads.
| Gross monthly income | Existing monthly debts | 28% housing limit | 36% total debt limit | Room after debts (36% − debts) | Recommended max housing payment |
|---|---|---|---|---|---|
| $4,000 | $200 | $1,120 | $1,440 | $1,240 | $1,120 |
| $4,000 | $600 | $1,120 | $1,440 | $840 | $840 |
| $6,000 | $300 | $1,680 | $2,160 | $1,860 | $1,680 |
| $6,000 | $700 | $1,680 | $2,160 | $1,460 | $1,460 |
| $8,000 | $500 | $2,240 | $2,880 | $2,380 | $2,240 |
| $8,000 | $1,000 | $2,240 | $2,880 | $1,880 | $1,880 |
| $10,000 | $600 | $2,800 | $3,600 | $3,000 | $2,800 |
| $10,000 | $1,400 | $2,800 | $3,600 | $2,200 | $2,200 |
Notice how at low debt the 28% front-end limit usually wins (it is the binding constraint), while as existing debt rises the 36%-minus-debt figure shrinks and takes over. You can check how your existing obligations stack up with a debt-to-income ratio calculation.
Interpreting Your Result
Your recommended housing payment comes from whichever of the two limits is lower, and which one governs tells you something useful about your finances.
- The 28% limit governs when \(0.28 \times \text{Income} \le 0.36 \times \text{Income} - \text{Debts}\), which simplifies to your existing non-housing debts being at or below 8% of gross income. In this case your other debts are modest, and housing affordability is set purely by the front-end ratio. Reducing debt further would not raise your housing budget — the front-end ceiling is the constraint.
- The 36%-minus-debt figure governs when existing monthly debts exceed 8% of gross income. Here your back-end room is the limiting factor: every dollar of monthly debt payment lowers your housing budget by a dollar. Paying down car loans, student loans or credit cards directly increases the housing payment the rule allows.
- A result of $0 or negative means \(0.36 \times \text{Income} - \text{Debts}\) has fallen to zero or below — your existing debt payments already consume all (or more than) the 36% back-end allowance. The rule indicates no room for a housing payment until debts are reduced or income rises. For example, $6,000 income with $2,200 of monthly debt leaves \(0.36 \times 6000 - 2200 = -40\), so the guideline would recommend $0.
These percentages mirror how many lenders evaluate borrowers: the front-end (housing) ratio and the back-end (total debt) ratio are standard underwriting screens, with 28% and 36% being common conforming benchmarks. Some loan programs allow higher ratios, so a result here is not a loan approval, a rate quote, or a guarantee of qualification. It is a budgeting guideline that estimates a sustainable payment before accounting for your down payment, interest rate, property taxes, insurance, HOA dues and credit profile.
To turn a housing payment into an estimated home price or loan amount, pair this figure with a full affordability calculation that factors in rate and term.
This is general educational information, not personalized financial advice. Consult a qualified mortgage or financial professional about your specific situation before making borrowing decisions.
Central bank policy rates today
The latest official policy rates of major central banks, updated automatically — the benchmark that bank deposit and loan rates follow.
- Federal Reserve · United States
- 3.75–4.00%
- As of
- 2026-11-13
- Change in 1 year
- 0 pp
Latest change Up +25 bp Federal Reserve changed its rate on 2026-09-17: from 3.50–3.75% to 3.75–4.00%.
| Central bank | Policy rate | As of | Change in 1 year |
|---|---|---|---|
| Banco Central do Brasil (Selic) · Brazil | 13.75% | 2026-11-16 | −1.25 pp |
| Banco de México · Mexico | 6.25% | 2026-11-10 | −1.00 pp |
| Federal Reserve · United States | 3.75–4.00% | 2026-11-13 | 0 pp |
| ECB | 2.50% | 2026-11-16 | +0.50 pp |
| Sveriges Riksbank · Sweden | 2.00% | 2026-11-16 | +0.25 pp |
| Saudi Central Bank (SAMA) · Saudi Arabia | 4.50% | 2026-10-29 | 0 pp |
| Reserve Bank of Australia · Australia | 4.60% | 2026-10-31 | +1.00 pp |
| Central Bank of the Republic of Türkiye · Türkiye | 36.00% | 2026-11-06 | −3.50 pp |
| Bank of Russia · Russia | 14.00% | 2026-11-10 | −2.50 pp |
| People’s Bank of China · China | 3.00% | 2026-11-10 | 0 pp |
| Bank of Canada · Canada | 2.50% | 2026-11-13 | +0.25 pp |
| Reserve Bank of India · India | 5.50% | 2026-10-19 | 0 pp |
| Bank of England · United Kingdom | 4.00% | 2026-11-16 | 0 pp |
| Bank of Japan · Japan | 1.25% | 2026-11-10 | +0.75 pp |
| Bank of Korea · South Korea | 3.00% | 2026-11-02 | +0.50 pp |
Federal Reserve: key rates and overnight market rates
The rates that frame monetary policy and the overnight market rate they steer, each with the date of its latest published value.
| Rate | Level | As of | Change in 1 year |
|---|---|---|---|
| Federal funds target range | 3.75–4.00% | 2026-11-13 | 0 pp |
| Effective federal funds rate (EFFR) | 3.88% | 2026-11-13 | 0 pp |
| Secured Overnight Financing Rate (SOFR) | 3.90% | 2026-11-13 | −0.10 pp |
Each rate keeps the date of its own latest published value; overnight market rates are published on the next business day.
Latest figure: 2026-11-13 Data last updated 2026-11-16 · current
Source: Banco Central do Brasil ODbL; Bank for International Settlements (BIS) Terms of permitted use of BIS statistics; Federal Reserve Bank of New York New York Fed Terms of Use; Board of Governors of the Federal Reserve System Public domain (U.S. government work); European Central Bank ECB reuse policy; Sveriges Riksbank Riksbank open data terms; The World Bank Group CC BY 4.0; Reserve Bank of Australia 2026 RBA copyright terms (Cash Rate); Bank of Canada Bank of Canada terms of use; Bank of England Open Government Licence v3.0
The one-year change is computed by CalculatorLib from these data. The EFFR and SOFR are subject to the Terms of Use posted at newyorkfed.org. The New York Fed is not responsible for publication of the EFFR and SOFR by CalculatorLib, does not sanction or endorse any particular republication, and has no liability for your use.
Source details and methodology
- Banco Central do Brasil
- Bank for International Settlements (BIS) — Central bank policy rates
- Federal Reserve Bank of New York — Reference rates (EFFR, SOFR)
- Board of Governors of the Federal Reserve System
- European Central Bank
- Sveriges Riksbank
- The World Bank Group — World Development Indicators (FR.INR.LEND, FR.INR.RINR)
- Reserve Bank of Australia 2026
- Bank of Canada
- Bank of England
FAQ
Does the 28% include taxes and insurance? Yes — housing cost generally means PITI: principal, interest, property taxes, and homeowners insurance (plus HOA dues if any).
Is gross or net income used? The 28/36 rule uses gross (pre-tax) income, which is the standard figure lenders evaluate.
Can I exceed these ratios? Some lenders approve higher ratios with strong credit or large down payments, but staying within 28/36 leaves a healthier financial cushion.