What is the Millionaire Savings Calculator?
This calculator tells you exactly how much you need to set aside each month to reach a savings goal — by default $1,000,000. It accounts for the money you've already saved, your expected annual investment return, and how many years you have to get there. It is useful for retirement planning, wealth-building targets, or any large savings objective.
How to use it
Enter your savings goal, your current balance, the annual rate of return you expect (as a percentage), and the number of years until your deadline. The calculator compounds your existing savings forward, subtracts that from your goal, and then computes the level monthly deposit needed to close the gap.
The formula explained
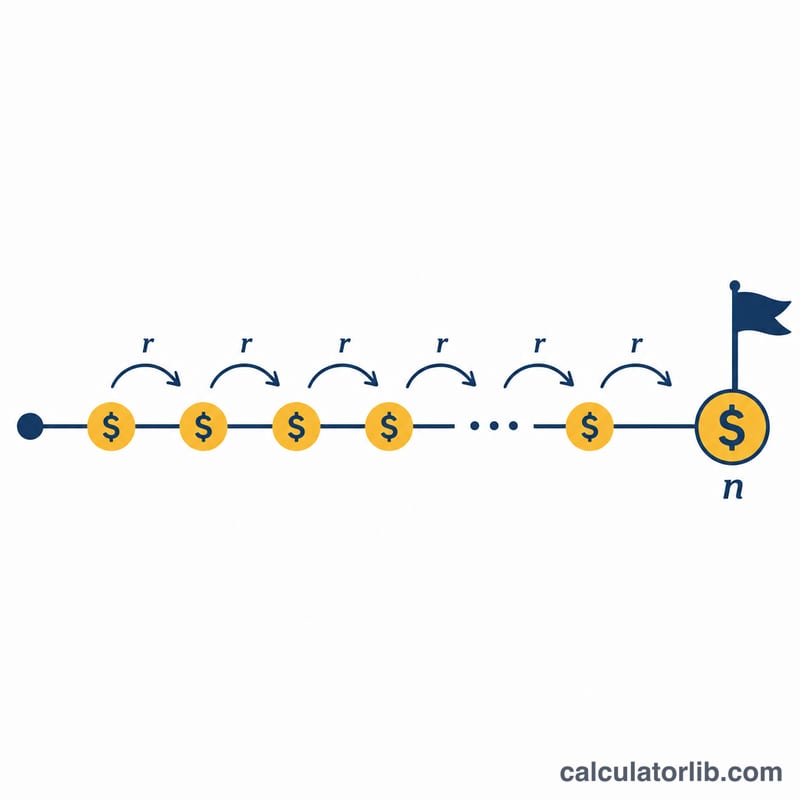
The core of the tool is the future-value-of-an-annuity equation solved for the payment: $$\text{PMT} = \frac{\text{FV} \times r}{(1 + r)^{n} - 1}$$ Here \(r\) is the monthly rate (annual rate ÷ 12), \(n\) is the number of months (years × 12), and FV is the amount still needed after current savings grow. When the return is 0%, the formula simplifies to \(\text{FV} \div n\).
Worked example
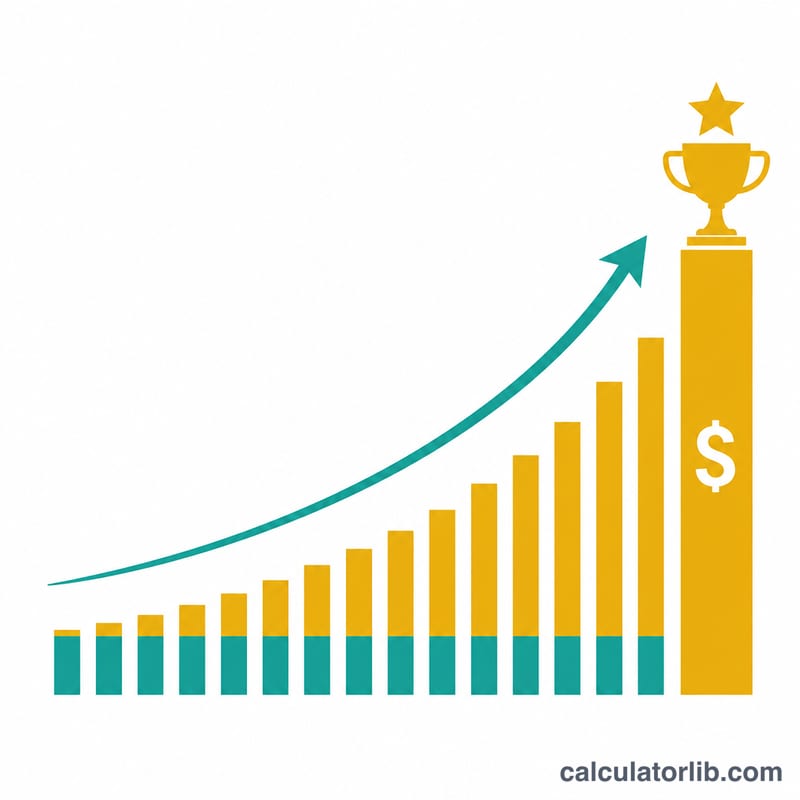
Goal $1,000,000, no current savings, 7% annual return, 30 years. The monthly rate is \(0.07/12 \approx 0.0058333\) and \(n = 360\) months. \((1.0058333)^{360} \approx 8.11650\), so the denominator is \(7.11650\). $$\text{PMT} = \frac{1{,}000{,}000 \times 0.0058333}{7.11650} \approx \$819.66 \text{ per month}$$ Over 30 years that is about $295,000 contributed and roughly $705,000 in growth.
Monthly Savings Needed to Reach $1,000,000: Scenario Comparison
The table shows the monthly deposit needed to reach $1,000,000 from a $0 starting balance. It uses \(\text{PMT} = \dfrac{ \text{FV}\cdot r}{(1+r)^{n}-1}\) with \(r = \text{annual rate}/12\) and \(n = \text{years}\times 12\). At 0% the formula reduces to \(\text{FV}/n\). Amounts are rounded to the nearest dollar, except the 30-year, 7% cell, which is shown to the cent.
| Timeline | 0% return | 5% return | 7% return | 9% return |
|---|---|---|---|---|
| 10 years (120 months) | $8,333 | $6,440 | $5,778 | $5,168 |
| 20 years (240 months) | $4,167 | $2,433 | $1,920 | $1,497 |
| 30 years (360 months) | $2,778 | $1,202 | $819.66 | $546 |
| 40 years (480 months) | $2,083 | $655 | $381 | $214 |
| 30 years, with $50,000 already saved | $2,639 | $933 | $487 | $402 |
Effect of a starting balance: a $50,000 starting balance grows on its own. At 7% over 30 years it becomes about \(50{,}000 \times 8.1165 \approx \$405{,}800\). The deposits then only need to cover the remaining gap, so the monthly amount falls from $819.66 to about $487. For the starting-balance row the formula becomes \(\text{PMT} = \dfrac{(\text{FV} - \text{Current}\,(1+r)^{n})\,r}{(1+r)^{n}-1}\).
Assumptions: all results are nominal (not adjusted for inflation) and pre-tax. They assume a constant return, deposits made at the end of each month, and monthly compounding. Fees are not included.
Interpreting Your Result
Contributions versus growth. In the 30-year, 7% example the deposit is $819.66 per month. Total contributions are \(819.66 \times 360 = \$295{,}077.60\), which is about 29.5% of the goal. The remaining \(1{,}000{,}000 - 295{,}077.60 = \$704{,}922.40\), about 70.5%, is investment growth under the assumed return. Most of that growth arrives in the later years, because earlier gains also earn returns (compounding).
Why time lowers the deposit more than return. Extra years add both more deposits and more compounding periods. In the table at 7%, going from 20 to 30 years cuts the deposit from about $1,920 to $819.66, a drop of roughly 57%. Going from 7% to 9% over 30 years cuts it from $819.66 to about $546, a drop of roughly 33%. Extending from 30 to 40 years at 7% lowers it further to about $381. A higher return helps, but the effect of time is larger across these scenarios.
Nominal dollars. The $1,000,000 target is a nominal amount. If prices rise over the years, it will buy less than $1,000,000 does today. The longer the timeline, the larger this gap becomes. The calculator does not adjust for inflation.
Constant return assumption. The formula assumes the same return every year. Real markets vary from year to year, and the actual balance can be above or below the projection, especially over shorter timelines.
Fees and taxes. The calculator does not model investment fees, taxes on gains or income, or account-specific rules. Any of these would reduce the ending balance compared with the figures shown. This is general information, not professional financial advice.
FAQ
What return should I assume? A diversified stock portfolio has historically averaged around 7% after inflation, but markets vary — try several rates.
What if I already have savings? The tool grows your current balance at the same return and only requires you to fund the remaining gap, lowering the monthly amount.
Does it account for taxes or inflation? No. Results are nominal pre-tax figures; adjust your target or return assumption to reflect inflation and taxes.