What Is a Multiplication Grid Chart?
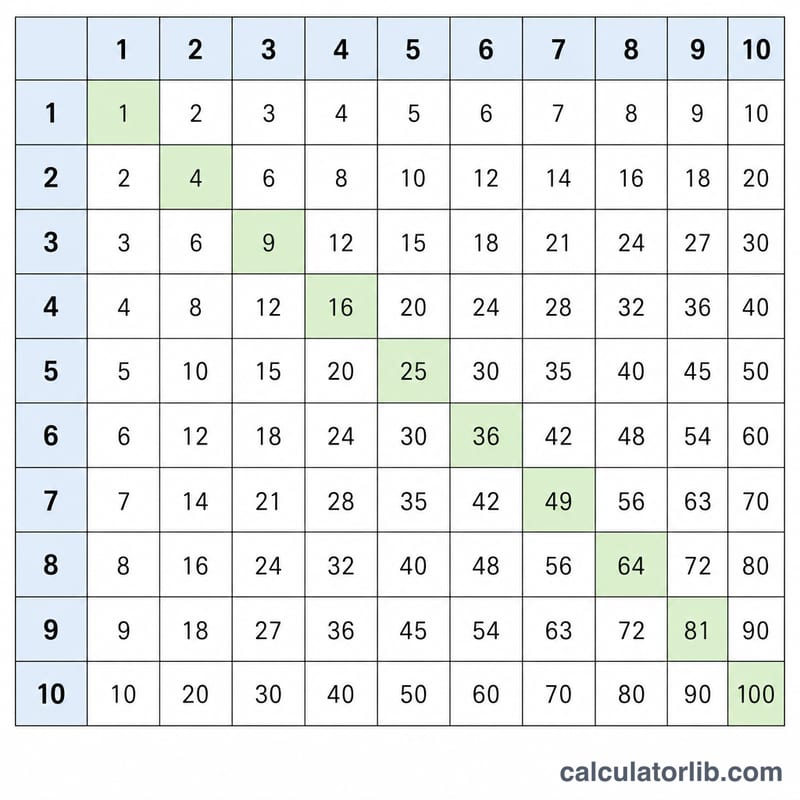
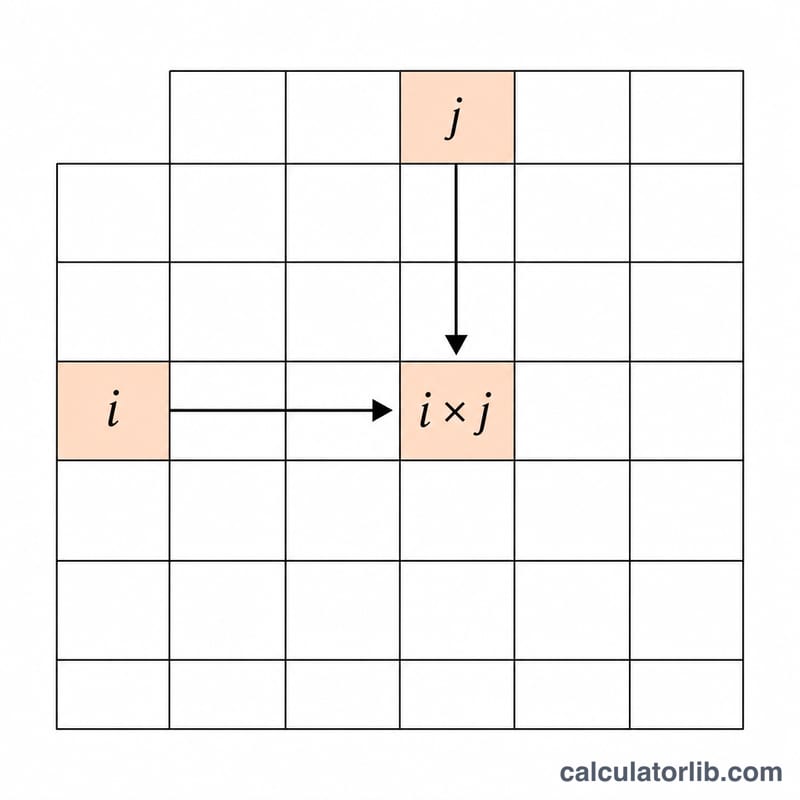
A multiplication grid (or times table chart) is a square table where the value in row i and column j is the product \(i \times j\). The headers run from 1 to N along the top and down the side, and each interior cell shows the result of multiplying its row and column labels. It is one of the most effective visual aids for learning multiplication facts, spotting number patterns, and understanding square numbers (which fall along the highlighted diagonal).
How to Use This Generator
Enter a grid size N between 1 and 20 and the tool builds a complete N × N table instantly. The squares (where i equals j) are highlighted so you can quickly see perfect squares like 4, 9, 16 and 25. Below the table you'll find the total number of cells, the largest product (N × N), and the sum of every product in the grid — handy for checking work or exploring patterns.
The Formula Explained
Every cell follows the simple rule \(\text{cell}(i,j) = i \times j\). The sum of all products in the grid has a neat closed form: it equals the square of the triangular number, \(\left(\frac{N(N+1)}{2}\right)^{2}\). For example, with N = 10 the row/column sum is $$1+2+\dots+10 = 55,$$ so the grand total is $$55^{2} = 3025.$$
Worked Example
For N = 3 the grid is:
Row 1: 1, 2, 3 — Row 2: 2, 4, 6 — Row 3: 3, 6, 9. There are 9 cells, the largest product is \(3 \times 3 = 9\), and the sum is $$\left(\frac{3\times 4}{2}\right)^{2} = 6^{2} = 36.$$
FAQ
What is the maximum grid size? You can generate up to a 20 × 20 chart, which is ideal for classroom and homework use.
Why are some cells highlighted? The diagonal cells where the row and column numbers match are the square numbers (1, 4, 9, 16, …), highlighted to make patterns easy to see.
Can I print the chart? Yes — the generated table is plain HTML and prints cleanly from your browser.