
What This Calculator Does
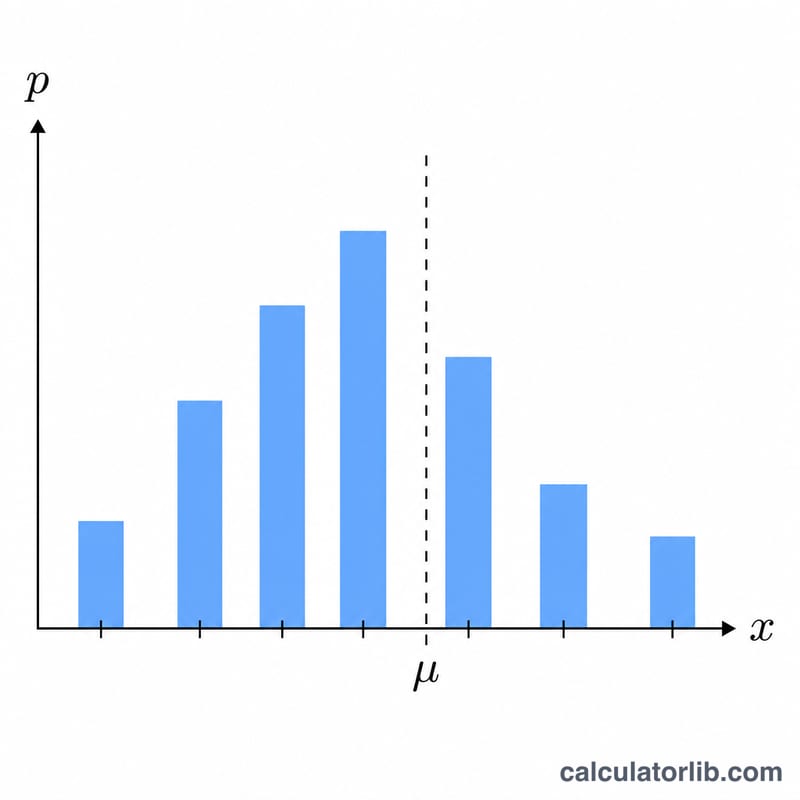
A discrete probability distribution lists every possible outcome of a random variable along with the probability of each outcome. This calculator takes that table — a set of values (x) and their matching probabilities (p) — and instantly computes the three numbers that summarize the distribution: the mean (expected value), the variance, and the standard deviation.
How to Use It
Enter your outcome values in the first box, separated by commas (for example 1, 2, 3, 4). In the second box enter the corresponding probabilities in the same order (for example 0.1, 0.2, 0.3, 0.4). Make sure both lists have the same number of entries and that the probabilities add up to 1. Click calculate to see the results. The tool also reports the sum of your probabilities so you can verify the distribution is valid.
The Formula Explained
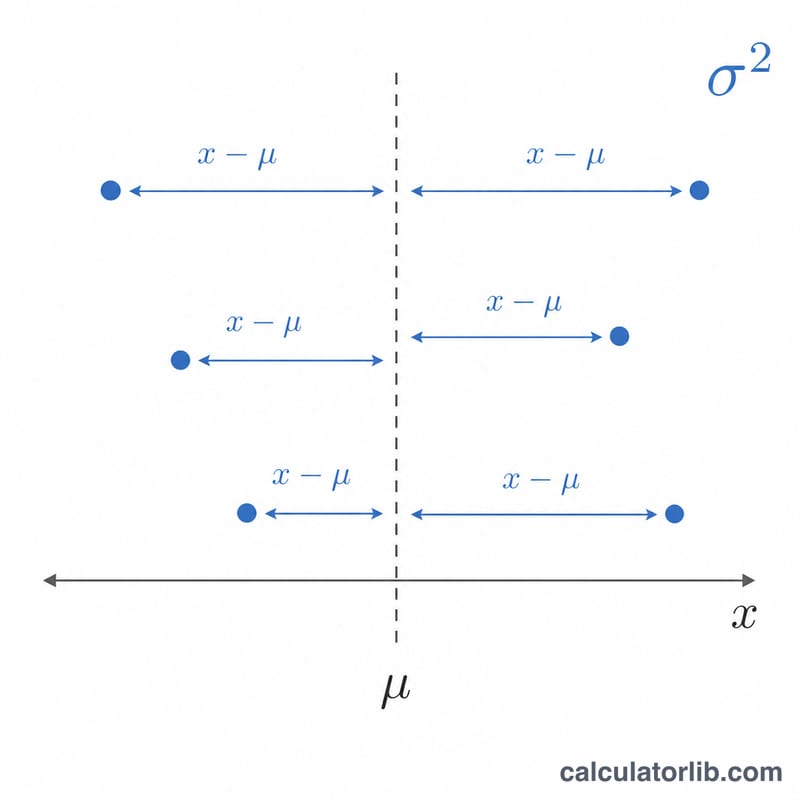
The mean, written \(\mu\), is the probability-weighted average: $$\mu = \sum_{i} x_i \cdot p_i$$ Each value is multiplied by its probability and the products are added together. The variance, written \(\sigma^{2}\), measures how far outcomes spread around the mean: $$\sigma^{2} = \sum_{i} \left(x_i - \mu\right)^{2} \cdot p_i$$ The standard deviation \(\sigma\) is simply the square root of the variance, expressing spread in the same units as the values.
Worked Example
Suppose x = 1, 2, 3, 4 with probabilities 0.1, 0.2, 0.3, 0.4. The mean is $$1(0.1) + 2(0.2) + 3(0.3) + 4(0.4) = 0.1 + 0.4 + 0.9 + 1.6 = 3.0$$ The variance is $$(1-3)^{2}(0.1) + (2-3)^{2}(0.2) + (3-3)^{2}(0.3) + (4-3)^{2}(0.4) = 0.4 + 0.2 + 0 + 0.4 = 1.0$$ so the standard deviation is \(\sqrt{1.0} = 1.0\).
FAQ
Do the probabilities have to sum to 1? Yes, for a valid distribution. The calculator shows the sum so you can confirm this; if it isn't 1, your results won't be meaningful.
What is the difference between variance and standard deviation? Variance is the average squared deviation from the mean; standard deviation is its square root, returning the measure to the original units.
Can I use negative values? Yes. Outcome values can be any real numbers; only the probabilities must be between 0 and 1.