
What this calculator works out
It answers one question: how big a pot you need on the day you retire so that a chosen standard of living lasts until your life expectancy — and then whether your current savings and contributions are on track to get there. It also tells you, if you are short, how much more to put away per month, per year, or as a percentage of pay, and prints a year-by-year balance table from your current age to your last year.
Reach for it when you are setting or sanity-checking a savings rate: choosing a contribution level, weighing an earlier retirement age, or testing what a different return assumption does to the finish line.
How to read each input
Only three of these are really assumptions about the future; the rest you can read off a payslip or a statement.
| Input | Where it comes from | Sensible range |
|---|---|---|
| Current age / retirement age / life expectancy | Your plan. Be generous with life expectancy — the pot is sized to run out exactly at that age. | Retirement 55–70; life expectancy 85–95 |
| Current pre-tax income | Gross salary. Commas and a dollar sign are fine. | Your actual figure |
| Annual income increase | Long-run raise rate, not this year's raise. | 2–4% |
| Retirement savings now | Total across all retirement accounts. | Your actual figure |
| Current annual savings | Everything going in, employer match included. Toggles between % of pay and flat dollars. | 10–20% of pay |
| Income needed after retirement | Rule of thumb: 70–85% of today's pay. The dollar option is per year, in today's money. | 70–85% |
| Average investment return | Long-run nominal return on the mix you hold. | 4–8% |
| Expected inflation | Long-run, not the latest print. | 2–3% |
| Other income after retirement | Pension or annuity payments, per month in retirement-date dollars. | 0 unless you have a fixed pension |
The formula
Write \(A\) = current age, \(R\) = retirement age, \(L\) = life expectancy, so \(m = R - A\) years of saving and \(n = L - R\) years of drawing down. With \(r\) = investment return, \(f\) = inflation, the real return is a plain subtraction, \(\rho = r - f\), and \(u = 1 + f\). Let \(I_{\text{ret}}\) be the yearly retirement income you asked for in today's money and \(O\) the other monthly income.
The target balance at retirement is the present value of a monthly withdrawal that starts at the inflated need and is discounted at the real rate:
$$N=\left(\frac{I_{\text{ret}}}{12}\,(1+f)^{m}-O\right)\times\frac{1-(1+\rho)^{-n}}{(1+\rho)^{1/12}-1}$$Your projected balance runs year by year, with the year's contribution \(C_k\) added at the end of the year:
$$B_{k+1}=B_k\,(1+r)+C_k,\qquad B_0=S_0$$and if \(B_m < N\), the level yearly top-up that closes the gap is
$$C=\frac{N-S_0(1+r)^{m}}{\dfrac{(1+r)^{m}-1}{r}},\qquad C_{\text{month}}=C\times\frac{(1+r)^{1/12}-1}{r}$$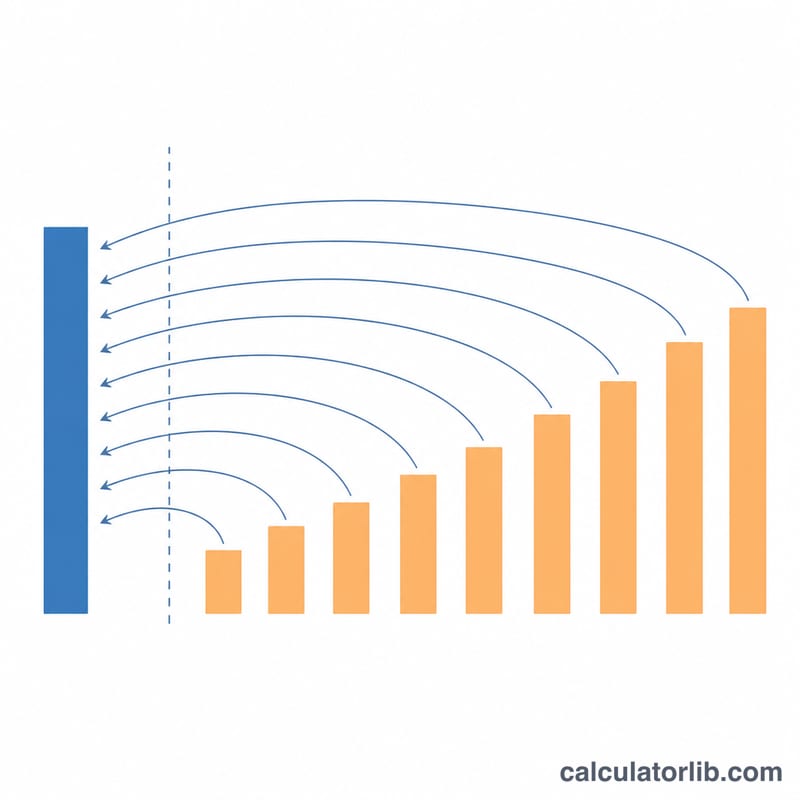
A worked example
Age 40, retiring at 65, life expectancy 90. Income $90,000 rising 3% a year, $120,000 saved, saving 12% of pay, needing 80% of income in retirement, 6% return, 2.5% inflation, no other income. So \(m = 25\), \(n = 25\), \(\rho = 0.06 - 0.025 = 0.035\).
The need in today's money is \(0.80\times 90{,}000 = 72{,}000\) a year, or $6,000 a month. Inflate it to the retirement date:
$$w=6{,}000\times 1.025^{25}=6{,}000\times 1.85394=11{,}123.66\ \text{per month}$$The annuity factor over 25 years of drawdown, at a monthly rate of \(1.035^{1/12}-1=0.0028709\):
$$\frac{1-1.035^{-25}}{0.0028709}=200.931$$ $$N=11{,}123.66\times 200.931=\$2{,}235{,}091\quad\rightarrow\quad \text{headline } \$2.24\text{M}$$The current plan starts at $120,000 growing at 6%, with contributions of $10,800 rising 3% a year added at each year end. The first row is \(120{,}000\times 1.06+10{,}800=138{,}000\), and 25 years of that reaches \(\$1{,}306{,}338\) — headline $1.31M, 58% of the target. The gap:
$$N-S_0(1+r)^{m}=2{,}235{,}091-120{,}000\times 1.06^{25}=2{,}235{,}091-515{,}024=1{,}720{,}066$$ $$C=\frac{1{,}720{,}066}{\frac{1.06^{25}-1}{0.06}}=\frac{1{,}720{,}066}{54.8645}=\$31{,}351\ \text{per year}$$ $$C_{\text{month}}=31{,}351\times\frac{1.06^{1/12}-1}{0.06}=\$2{,}543\ \text{per month}$$Or 26.08% of pay every year. The projected pot would fund $6,501 a month at 65 — $3,507 in today's money — against the $11,124 the plan calls for.
The rules that surprise people
Your raises do not raise your target. "Annual income increase" never touches the number you need. The retirement income you ask for is a share of today's pay, carried forward by inflation alone. On the default inputs, changing the raise rate from 3% to 10% leaves the $1.88M target untouched — it only grows your future contributions and changes the "% of income" answer.
The real return is subtraction. The tool uses \(\rho = r - f\), not the textbook \((1+r)/(1+f)-1\), which makes it the slightly less conservative of the two: on the default inputs it produces $1,884,793 where the ratio form gives $1,898,050. If \(f\) exceeds \(r\), \(\rho\) simply goes negative and the same formula runs.
Two dollar fields, two different clocks. If you switch retirement income to dollars, that is dollars per year in today's money, and it gets inflated to the retirement date. Other income is dollars per month at the retirement date, subtracted straight from the inflated need and never adjusted. In the example above, entering $2,000 of other monthly income cuts the target from $2.24M to $1.83M — but that $2,000 is only worth about $1,079 in today's money.
Contributions land at year end. The year's deposit earns nothing in its own year: on the defaults, \(30{,}000\times 1.06+7{,}000=38{,}800\), not \(37{,}000\times 1.06=39{,}220\). Over 32 years that convention is worth about $54,000 of projected balance, so the table is deliberately cautious.
Withdrawals in the table rise every year. The drawdown is level in real terms but printed in future dollars, so the Distribution column grows with inflation even though your purchasing power is flat. On the defaults it runs from $79,873 at age 67 to $132,018 at 84, with the balance landing on exactly zero.
The three "how much to save" answers do not convert into each other. On the defaults, $1,510 a month is not $18,607 ÷ 12 (that would be $1,551) — it is twelve monthly deposits compounding to the yearly figure. And 18.69% is not $18,607 ÷ $70,000 (26.58%) — it is a constant share of a growing salary. The gap is expected, not an error.
Headline figures are rounded; the table is not. Above $1M the headline shows two decimals of millions, so $1,884,793 in the table prints as $1.88M above it; between $100,000 and $1M it rounds to the nearest thousand. Use the table for the exact figure. The monthly income figure and the table's first-year withdrawal also use different compounding conventions and will not agree exactly (12 × $11,266 = $135,192 against $137,041 in the table).
Some inputs change what appears at all. Land within 91–110% of your target and the tool says you have "close to what you will need" and stops naming your projected dollar figure — though the full table stays until you actually reach 100%. A retirement age at or below your current age gets "you are in retirement already"; other income large enough to cover the need gets "you don't need to save".
Questions people ask
Does this account for Social Security?
Only if you put it in. Use "other income after retirement", remembering it is dollars per month at the retirement date, not today's. If you would rather work in today's money, inflate your estimate yourself by \((1+f)^{m}\) before entering it.
Why doesn't my target move when I change the income increase?
It never does. That field only affects how fast your contributions grow — and only when you are saving a percentage of pay — plus the "percent of income" answer. If you save a flat dollar amount instead, changing it leaves the whole table identical.
Should I use my nominal or real return?
Nominal — put your inflation assumption in its own field. The tool takes the difference internally. Entering a real return and 0% inflation gives a different answer, because inflation also scales the income target and the printed withdrawals.
Why does the balance end at exactly zero?
By design: the pot is sized to be exhausted at your life expectancy, leaving nothing behind. If you want a cushion or a bequest, either extend life expectancy by several years or raise the retirement income percentage.
Are these figures after tax?
No — income and withdrawals are both pre-tax, so a Roth balance is worth more than the same figure in a traditional account. Taxes and contribution limits are not modelled.
Interpreting Your Result
The calculator returns four things: a target balance at retirement, a projected balance, the surplus or shortfall between them, and the extra saving required to close any gap. Each has a precise meaning.
Target balance at retirement
The target is a present value computed at your retirement date, not today. It is the lump sum that, earning the assumed nominal return \(r\), can pay a first-year withdrawal \(W\) that then grows every year with inflation \(f\), for \(n = \text{life expectancy} - \text{retirement age}\) years:
$$S = W\cdot\frac{1-\left(\dfrac{1+f}{1+r}\right)^{n}}{r-f}$$\(W\) itself is your current income grown at the annual income-increase rate to the retirement date, multiplied by the replacement percentage, minus any other annual retirement income you entered. Because the income is inflated forward, the target is expressed in retirement-date (nominal) dollars — it will look large next to today's prices, and that is arithmetic, not an error. The pot is sized to hit exactly zero in the final year.
Projected balance
The projected balance is what your existing savings plus your planned contributions compound to by the retirement age, at the same assumed nominal return. It answers "where is the current plan heading?" and uses no new information beyond the inputs you gave.
Surplus, shortfall, and the required extra saving
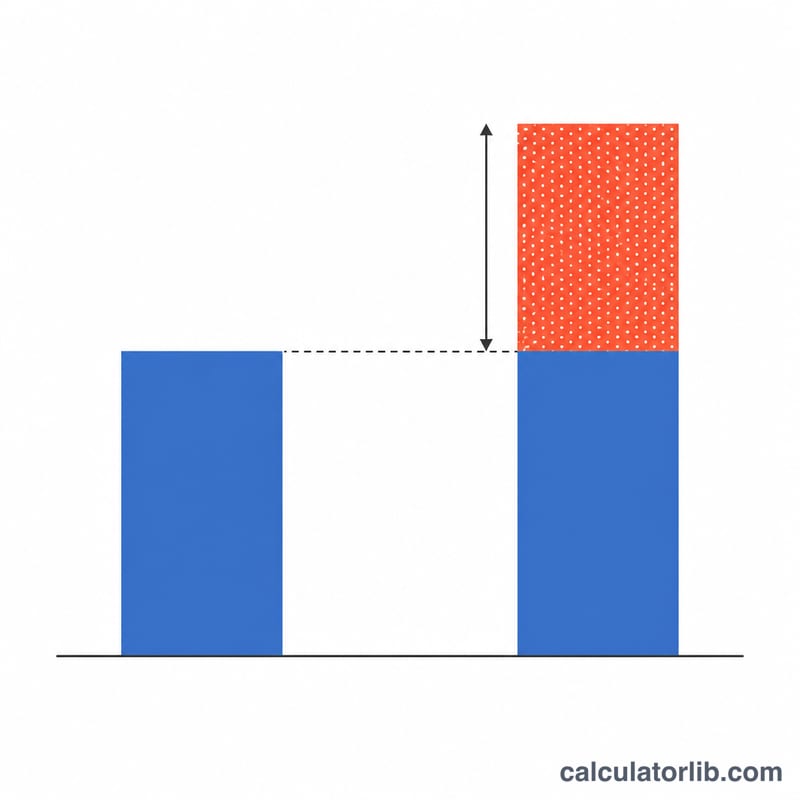
Surplus means the projection exceeds the target; shortfall means it falls short. A shortfall equal to, say, 30% of the target does not mean contributions must rise 30% — the gap is closed by new money that compounds for fewer years than money already invested, so the required increase in contributions is usually a different (often larger) percentage than the shortfall percentage.
The required extra saving is displayed three ways — per month, per year, and as a percent of gross pay. These are the same single amount expressed in three units. They are alternatives, not items to be added together.
What the model does not include
- Government or state retirement benefits — U.S. Social Security, a UK State Pension, or any national scheme is counted only if you enter it in the "other monthly income at retirement" field. Rules, ages and amounts differ by country.
- Taxes on withdrawals, on investment growth, or on contributions. All figures are gross.
- Sequence-of-returns risk — a fixed return each year is assumed, so a poor run of returns in the first retirement years, which can permanently damage a drawdown plan, is not modelled.
- Longevity beyond the entered age — money runs out the year after the horizon ends.
- Healthcare and long-term-care shocks, one-off expenses, home purchases, or changes in spending pattern (many retirees spend unevenly rather than at a constant inflation-adjusted rate).
- Volatility, fees and currency effects — the return input is a single smooth nominal rate; real portfolios fluctuate and charges reduce net returns.
Zero balance, no buffer, no bequest
Because the drawdown is engineered to end at exactly zero, the plan leaves nothing for heirs and no reserve for surprises. Any margin for those must be added deliberately — for example by entering a longer life expectancy, a higher replacement percentage, or a lower return.
Reading the year-by-year table
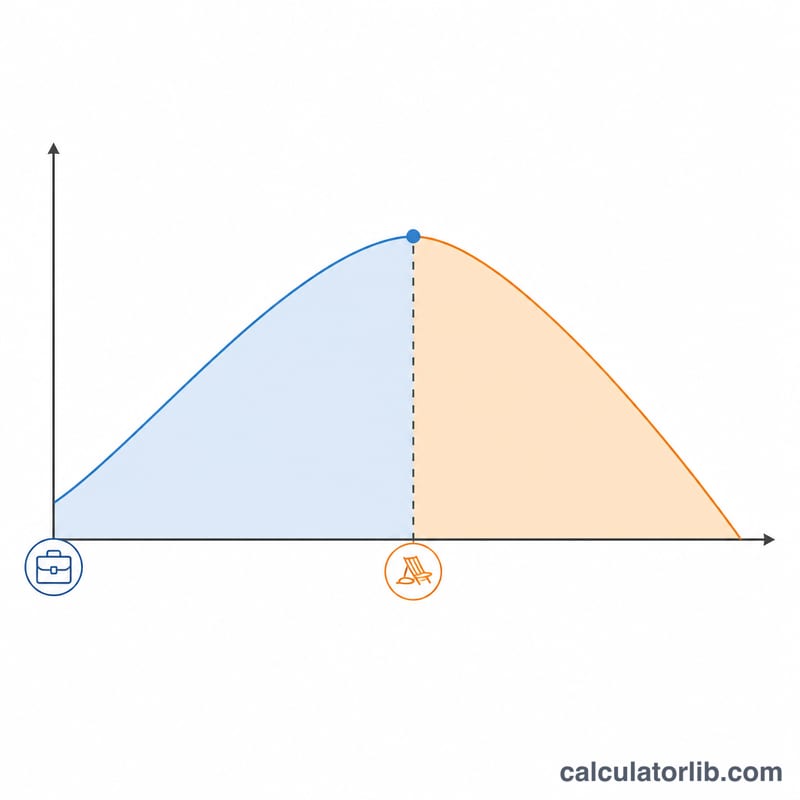
The schedule shows the balance rising through the accumulation years and peaking in the year you retire; after that, withdrawals grow with inflation while the remaining balance still earns the assumed return, so the balance declines — slowly at first, then steeply — reaching zero in the final year of the horizon.
This is general educational information about how the calculation works, not financial or tax advice. Outputs are only as good as the assumptions entered, and small changes to return, inflation or horizon move the target substantially.
How the Target Changes Across Scenarios
All rows below start from one common baseline and change a single assumption at a time. Baseline: current age 35, retire at 65, life expectancy 90, current income $70,000, income increase 2.5%/yr, replacement income 75%, current savings $60,000, saving 12% of pay, investment return 6%, inflation 2.5%, no other retirement income. Figures are rounded and are in retirement-date dollars.
| Scenario (one change from baseline) | Target balance at retirement | Projected balance | Shortfall (−) / surplus (+) | Extra saving needed |
|---|---|---|---|---|
| Baseline — retire at 65 | $1,787,000 | $1,220,000 | −$568,000 | ≈$565 / month |
| Retire at 60 (30 drawdown years) | $1,765,000 | $843,000 | −$923,000 | ≈$1,332 / month |
| Retire at 70 (20 drawdown years) | $1,741,000 | $1,736,000 | −$5,000 | ≈$3 / month |
| Investment return 4% | $2,236,000 | $836,000 | −$1,400,000 | ≈$2,020 / month |
| Investment return 8% | $1,460,000 | $1,820,000 | +$360,000 | none required |
| Life expectancy 95 instead of 90 | $1,997,000 | $1,220,000 | −$778,000 | ≈$774 / month |
| Other income $1,500 / month at retirement | $1,495,000 | $1,220,000 | −$275,000 | ≈$274 / month |
What moves the number most
The assumed investment return dominates the target: 4% versus 8% swings it from about $2,236,000 to about $1,460,000 — a spread of roughly $776,000 on identical spending plans — because the same rate discounts the withdrawals and compounds the savings. Two other single-factor changes, shown here in text rather than a row: raising inflation from 2.5% to 3% lifts the target from $1,787,000 to about $1,880,000, while lowering it to 2% cuts it to about $1,701,000; changing the replacement rate from 75% to 85% raises the target to about $2,026,000, and 70% lowers it to about $1,668,000 (the target scales linearly with the replacement rate once other income is zero).
Retirement age behaves unusually. Retiring at 60 versus 70 barely changes the target here (about $1,765,000 versus $1,741,000) because two effects nearly cancel — a longer drawdown horizon versus a smaller inflated salary base — but it transforms the shortfall, from about $923,000 to almost nothing, because ten more years of compounding contributions is what actually closes the gap.
Every target in this table comes from the same formula shown above, with the same inputs you would type into the calculator. Projected balances assume contributions of 12% of pay made at year end and rising with the 2.5% income increase; the "extra saving" column is a level monthly amount earning the same nominal return until retirement, so your own result may differ slightly if a different contribution-timing convention is applied. These illustrations are general and country-neutral — they include no tax, and no state or employer pension unless entered as other income.
Key Terms Defined
- Nominal return — the headline annual growth rate of the portfolio, before adjusting for inflation. This is the "investment return (%)" input, \(r\).
- Inflation — the assumed annual rise in the general price level, \(f\). It makes each year's withdrawal larger in cash terms so that purchasing power stays constant.
- Real return — return after inflation. This model discounts using the spread \(r-f\) in the denominator together with the growth factor \(\left(\frac{1+f}{1+r}\right)^{n}\). Note: the exact Fisher definition of the real rate is \(\frac{1+r}{1+f}-1\), which is slightly below the simple difference \(r-f\) (with 6% and 2.5%, 3.41% versus 3.50%).
- Replacement rate (income needed after retirement) — the share of pre-retirement gross income you plan to spend each year in retirement, entered as a percent (or as a fixed amount). Values below 100% reflect that some costs — commuting, retirement contributions themselves — usually stop.
- Today's money vs retirement-date (nominal) dollars — today's money values a sum at current prices; nominal dollars value it at the prices of the future date. This tool reports the target in retirement-date dollars, so it is deliberately larger than the equivalent figure in today's money.
- Target balance at retirement — the lump sum needed on the retirement date to fund the whole inflation-adjusted withdrawal stream to the planning horizon.
- Projected balance — what current savings plus planned future contributions are forecast to be worth on the retirement date at the assumed nominal return.
- Shortfall / surplus — projected balance minus target balance: negative is a shortfall (more saving, more time, or lower spending would be needed); positive is a surplus.
- Accumulation phase — the working years from your current age to the retirement age, when contributions and returns build the balance.
- Decumulation phase (drawdown) — the retirement years from the retirement age to the planning horizon, when withdrawals exceed growth and the balance falls.
- Present value of an annuity — the lump sum today that is financially equivalent to a series of future payments, given a discount rate. The target balance is the present value, at the retirement date, of a growing annuity whose payments rise at \(f\).
- Life expectancy (as used here) — a planning horizon you choose, not a forecast of your lifespan. Roughly half of people at a given age outlive an average-based figure, so a longer horizon is a common way to build in margin.
- Other retirement income — regular income from outside the pot, entered as a monthly amount at retirement: a state or government benefit (for example U.S. Social Security or a UK State Pension), a defined-benefit or workplace pension, an annuity, or rental income. It is subtracted from the required annual withdrawal, so it directly reduces the target.
- Employer match — contributions an employer adds to a workplace retirement account, often as a percentage of pay conditional on your own contribution. It is not a separate field here; if you want it counted, include it in the annual savings figure. Match rules and limits are set by national law and employer policy.
- Savings rate (% of gross pay) — annual contributions expressed as a percentage of gross (pre-tax) income. Because the calculator can also express the required extra saving in this unit, the two are directly comparable.
- Drawdown to zero — the modelling assumption that the balance is exhausted exactly at the end of the planning horizon, leaving no bequest and no reserve.
These definitions are general educational information, not financial advice; terminology and the treatment of pensions and taxes vary by country.