What Is the Spending Multiplier?
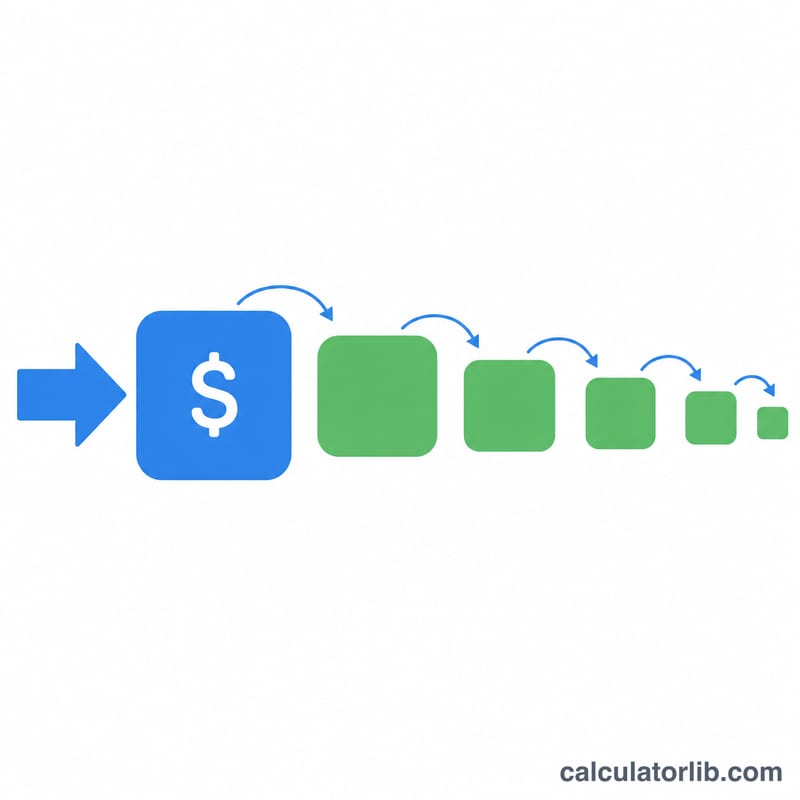
The spending multiplier (also called the Keynesian or fiscal multiplier) measures how much total economic output changes in response to an initial change in spending. When a household, business, or government spends an extra dollar, that dollar becomes income for someone else, who in turn spends a portion of it — creating a ripple effect through the economy. The multiplier captures the cumulative size of that ripple.
How to Use This Calculator
Enter the Marginal Propensity to Consume (MPC) — the fraction of each extra dollar of income that gets spent rather than saved (a value between 0 and 1). Then enter the change in spending (the initial injection). The calculator returns the multiplier, the implied marginal propensity to save (MPS), and the estimated total change in GDP.
The Formula Explained
The multiplier is \(k = \dfrac{1}{1 - \text{MPC}}\). Because \(\text{MPC} + \text{MPS} = 1\), this is equivalently \(k = \dfrac{1}{\text{MPS}}\). A higher MPC means more of each dollar is re-spent, so the multiplier is larger. The total impact on output is then
$$\Delta \text{GDP} = k \times \text{Change in Spending}$$where
$$k = \frac{1}{1 - \text{MPC}}, \qquad \text{MPS} = 1 - \text{MPC}$$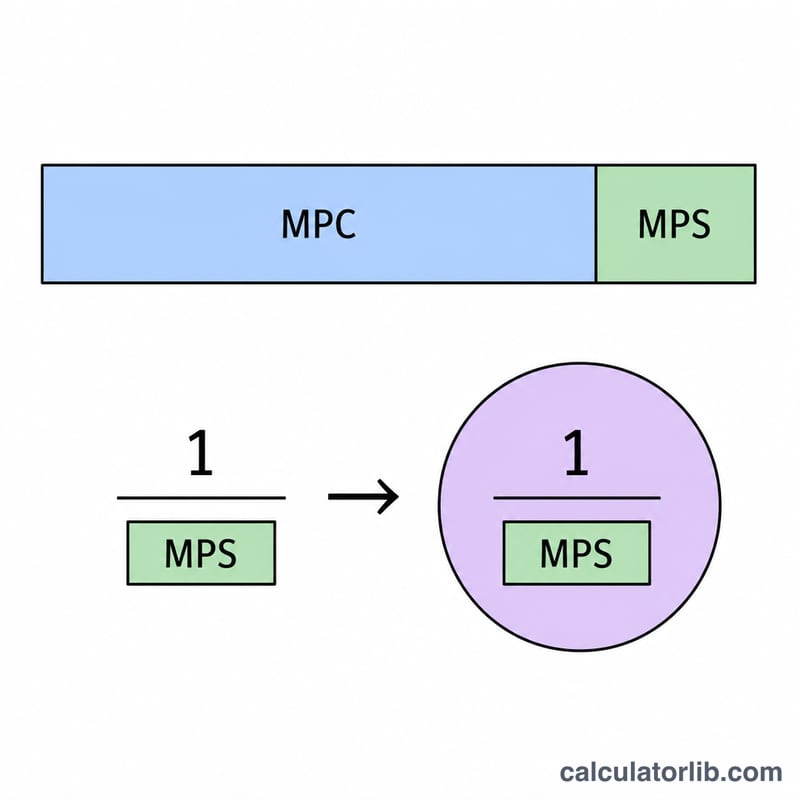
Worked Example
Suppose the MPC is 0.8 and the government increases spending by $1,000,000. The MPS is \(1 - 0.8 = 0.2\), so the multiplier is \(\dfrac{1}{0.2} = 5\). The total change in GDP is
$$\Delta \text{GDP} = 5 \times \$1{,}000{,}000 = \$5{,}000{,}000$$The original injection grows fivefold as it circulates through the economy.
Multiplier Across Different MPC Values
The table applies the simple Keynesian multiplier \(k = \frac{1}{1-\text{MPC}}\) to a fixed initial spending change of $1,000,000. The marginal propensity to save is \(\text{MPS} = 1 - \text{MPC}\).
| MPC | MPS | Multiplier (1/(1−MPC)) | Total GDP change for $1,000,000 |
|---|---|---|---|
| 0.50 | 0.50 | 2 | $2,000,000 |
| 0.60 | 0.40 | 2.5 | $2,500,000 |
| 0.70 | 0.30 | 3.33 | $3,333,333 |
| 0.75 | 0.25 | 4 | $4,000,000 |
| 0.80 | 0.20 | 5 | $5,000,000 |
| 0.90 | 0.10 | 10 | $10,000,000 |
| 0.95 | 0.05 | 20 | $20,000,000 |
The relationship is nonlinear. Raising MPC from 0.50 to 0.60 adds only 0.5 to the multiplier. Raising it from 0.90 to 0.95 adds 10. As MPC approaches 1, the denominator \(1-\text{MPC}\) approaches 0 and the multiplier grows without bound in this simple model.
Key Terms and Definitions
- Marginal propensity to consume (MPC): the fraction of each additional unit of income that is spent on consumption. It ranges from 0 to 1.
- Marginal propensity to save (MPS): the fraction of each additional unit of income that is saved. Since income is either consumed or saved, \(\text{MPC} + \text{MPS} = 1\).
- Spending (fiscal/Keynesian) multiplier: the ratio of the total change in output (GDP) to the initial change in spending. In the simple model it is \(\frac{1}{1-\text{MPC}} = \frac{1}{\text{MPS}}\).
- Autonomous spending: spending that does not depend on current income, such as some government purchases, baseline investment, or a minimum level of consumption.
- Injection: money added to the circular flow of income, such as investment, government spending, or exports.
- Leakage (withdrawal): money removed from the circular flow, namely savings, taxes, and imports. Leakages reduce the size of each round of spending.
- Gross domestic product (GDP): the total market value of final goods and services produced in an economy over a period, usually a year or a quarter.
Interpreting the Multiplier Result
A multiplier of \(k\) means that, in this simple model, each $1 of initial spending leads to $\(k\) of total output. The initial spending becomes income for others. They spend the fraction MPC of it, which becomes income for others again, and so on. The total is the geometric series \(1 + \text{MPC} + \text{MPC}^2 + \dots = \frac{1}{1-\text{MPC}}\).
A multiplier of 1 corresponds to MPC = 0. Nothing is re-spent, so there is no ripple effect and the total change in GDP equals the initial change in spending.
This calculator uses the simple closed-economy model with no taxes, no imports, and no price or interest-rate responses. Real-world multipliers are usually lower than this formula suggests, because taxes, saving, imports, and crowding out of private spending all reduce each round of spending. The size of the effect also depends on economic conditions.
A common extension includes a proportional tax rate \(t\): \(k = \frac{1}{1 - \text{MPC}(1-t)}\). For example, with MPC = 0.8 and t = 0.25, \(\text{MPC}(1-t) = 0.8 \times 0.75 = 0.6\), so \(k = \frac{1}{1-0.6} = 2.5\). This is lower than the no-tax multiplier of 5.
The results describe a textbook model and are not forecasts, policy recommendations, or financial advice.
GDP and GDP per capita: United States
Official GDP and population figures for United States, updated automatically. They work the formula above with real numbers.
- GDP per capita 2025
- 90,027 USD
- GDP 2025
- 30,770 billion USD
- Population 2025
- 341.78 million
Latest change Up +4.5% 2025: 90,027 USD, against 86,170 USD in 2024. CalculatorLib computes this change from the two published figures.
In 2025, the GDP of United States was 30,770 billion USD and its population 341.78 million: 30,770 billion ÷ 341.78 million = 90,027 USD per person.
GDP deflator 2025: nominal GDP 30,770 billion USD ÷ real GDP 25,147 billion USD × 100 = 122.36.
| Year | GDP (billion USD) | Population (million) | GDP per capita (USD) | GDP deflator |
|---|---|---|---|---|
| 2025 | 30,770 | 341.78 | 90,027 | 122.4 |
| 2024 | 29,298 | 340.00 | 86,170 | 119.0 |
| 2023 | 27,812 | 336.76 | 82,587 | 116.1 |
| 2022 | 26,055 | 334.00 | 78,009 | 112.0 |
| 2021 | 23,726 | 332.10 | 71,441 | 104.6 |
| 2020 | 21,375 | 331.58 | 64,465 | 100.0 |
| 2019 | 21,540 | 330.23 | 65,228 | 98.7 |
| 2018 | 20,657 | 328.53 | 62,876 | 97.1 |
| 2017 | 19,612 | 326.61 | 60,048 | 94.9 |
| 2016 | 18,805 | 324.35 | 57,977 | 93.2 |
United States and other countries
GDP per capita in current US dollars — each country’s latest published year.
- United States 90,027 USD (2025)
- France 48,986 USD (2025)
- South Korea 36,227 USD (2025)
- Japan 35,951 USD (2025)
- Saudi Arabia 34,537 USD (2025)
- Türkiye 18,599 USD (2025)
- Russia 17,547 USD (2025)
- World 14,406 USD (2025)
- Mexico 13,889 USD (2025)
- China 13,862 USD (2025)
- Vietnam 5,066 USD (2025)
- India 2,702 USD (2025)
No published figure yet for Taiwan.
Years can differ between rows: each figure is shown with its own year. The same World Bank indicator for every country.
Latest figure: 2025 Data last updated 2026-10-17 · current
Source: The World Bank Group CC BY 4.0; World Bank, World Development Indicators CC BY 4.0
The GDP ÷ population example and the GDP deflator worked from nominal and real GDP are computed by CalculatorLib from these data.
Source details and methodology
- The World Bank Group — World Development Indicators (NY.GDP.PCAP.CD, NY.GDP.MKTP.CD, NY.GDP.DEFL.ZS, NY.GDP.MKTP.CN, NY.GDP.MKTP.KN)
- World Bank, World Development Indicators — World Development Indicators (SP.POP.TOTL)
FAQ
Does a higher MPC give a bigger multiplier? Yes. The closer the MPC is to 1, the more income is re-spent at each round, producing a larger multiplier.
What if MPC equals 1? The formula would divide by zero, implying an infinite multiplier — unrealistic, so this tool caps MPC just below 1.
Is this a real-world prediction? It's a simplified model. Real multipliers are affected by taxes, imports, interest rates, and capacity constraints, which can shrink the effect.