
What this calculator does
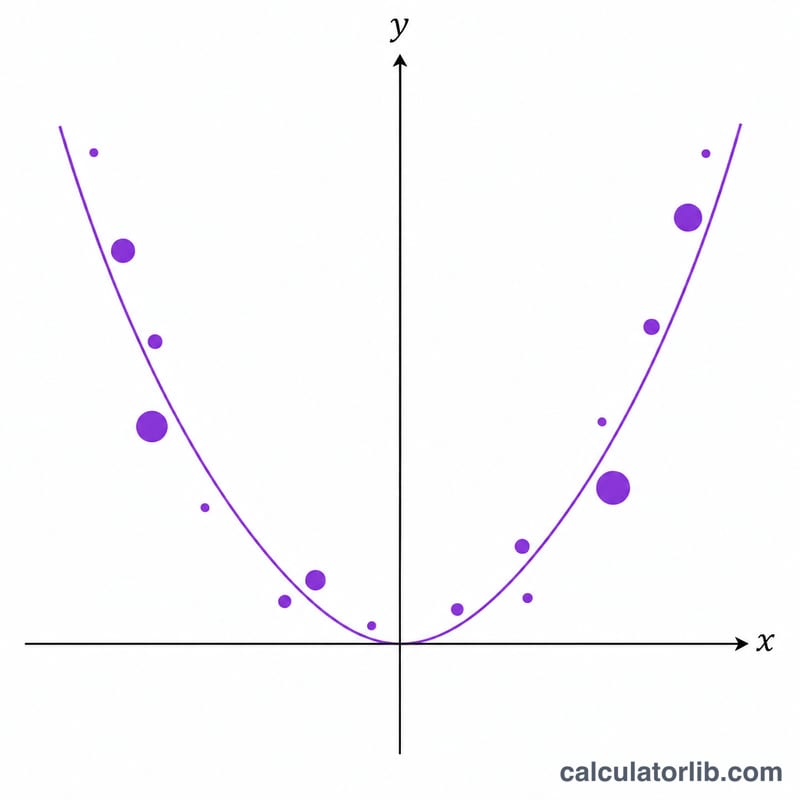
The Weighted Quadratic Regression Calculator fits a second-degree polynomial, \(y = A + Bx + Cx^2\), to a set of (x, y) data points where each point may carry a frequency or weight f. This is the frequency-table form of quadratic least squares: a point that occurs f times contributes f times to every sum. If you set every frequency to 1, the math reduces to ordinary (unweighted) quadratic regression. This is pure statistics and applies identically in any country or field.
How to use it
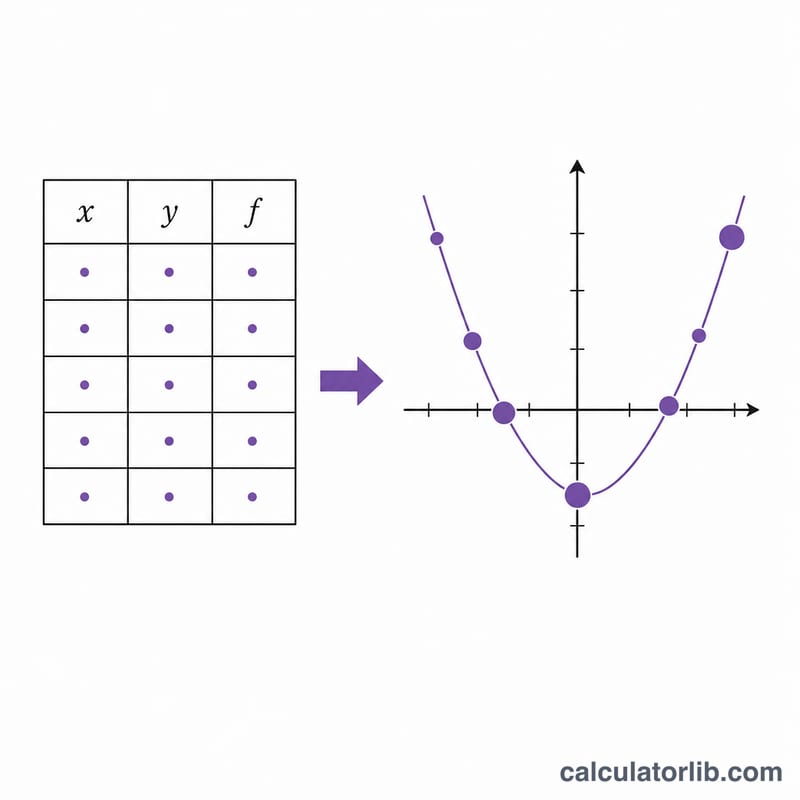
Enter one data point per line as x, y, f. The frequency f is optional and defaults to 1 when left blank, so 2, 5 means x=2, y=5 with weight 1. Choose how many significant digits to display (default 10). You need at least 3 distinct x values for a quadratic to be uniquely determined. The tool reports the coefficients A, B, C and the multiple correlation coefficient r of the fit.
The formula explained
Let \(n = \Sigma f\) be the total weight. Compute weighted means \(\bar{x} = \Sigma xf/n\), \(\bar{y} = \Sigma yf/n\), and \(\overline{x^2} = \Sigma x^2 f/n\). Form the centered sums \(S_{xx}\), \(S_{xy}\), \(S_{xx^2}\), \(S_{x^2x^2}\), \(S_{x^2y}\), then solve the 2\(\times\)2 system for B and C with denominator $$\text{denom} = S_{xx}\cdot S_{x^2x^2} - S_{xx^2}^{2}:$$ $$B = \frac{S_{xy}\cdot S_{x^2x^2} - S_{xx^2}\cdot S_{x^2y}}{\text{denom}}$$ and $$C = \frac{S_{xx}\cdot S_{x^2y} - S_{xx^2}\cdot S_{xy}}{\text{denom}}.$$ Finally \(A = \bar{y} - B\cdot\bar{x} - C\cdot\overline{x^2}\). The correlation coefficient is \(r = \sqrt{1 - \text{SSE}/\text{SST}}\), where SSE is the weighted residual sum of squares and SST the weighted total sum of squares.
Worked example
Data with all f = 1: (1,2), (2,3), (3,6), (4,11), (5,18). Here n=5, \(\bar{x}=3\), \(\bar{y}=8\), \(\overline{x^2}=11\). The sums give \(S_{xx}=10\), \(S_{xy}=40\), \(S_{xx^2}=60\), \(S_{x^2x^2}=374\), \(S_{x^2y}=254\), and $$\text{denom} = 10\cdot374 - 60^2 = 140.$$ Then $$B = \frac{40\cdot374 - 60\cdot254}{140} = -2,$$ $$C = \frac{10\cdot254 - 60\cdot40}{140} = 1,$$ and $$A = 8 - (-2)(3) - 1\cdot11 = 3.$$ The fit \(y = 3 - 2x + x^2\) reproduces every point exactly, so SSE = 0 and r = 1.
FAQ
What does the frequency column do? It is the weight (count) of that (x, y) pair. A row with f = 4 counts as four identical observations, which is convenient for grouped or tabulated data.
Why do I need 3 distinct x values? A parabola has three parameters (A, B, C). Fewer than three distinct x values makes the system singular and the fit undetermined; the calculator then reports an error.
How is r interpreted? r ranges from 0 to 1. Above 0.7 indicates a strong fit, 0.4–0.7 moderate, 0.2–0.4 weak, and below 0.2 essentially none.


