What is the Weighted Curve Regression Calculator?
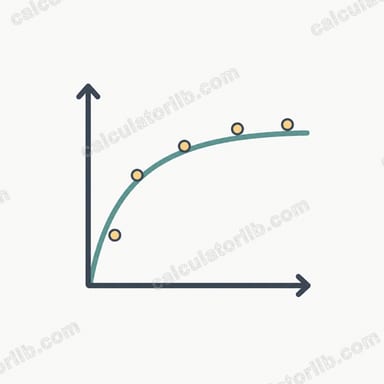
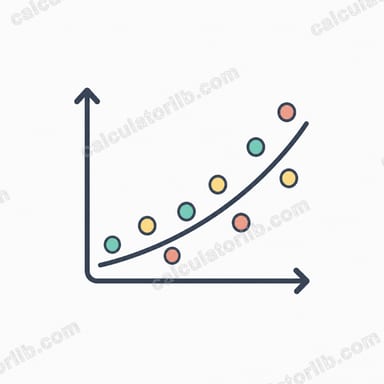
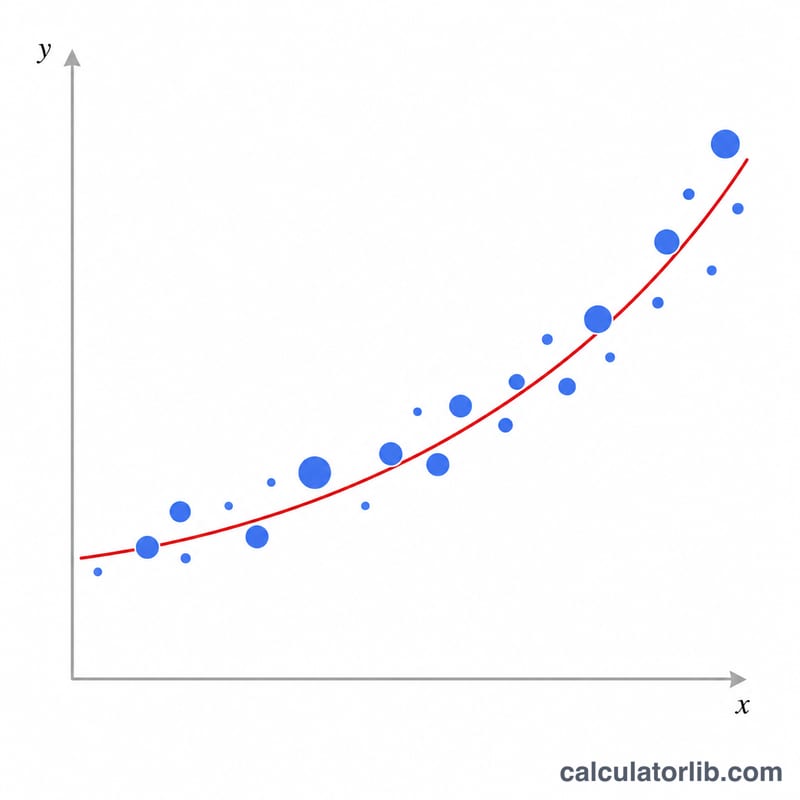
This tool fits one of seven curve models to a table of (x, y, frequency) data points using frequency-weighted least squares. Each point is counted as many times as its frequency f, so repeated observations carry proportional influence. It is a pure-mathematics / statistics tool and applies identically everywhere.
How to use it
Enter one row per line as x y f (values separated by spaces or commas). The frequency f is optional and defaults to 1; it must be at least 0. Choose a regression type and the number of significant digits to display, then read the fitted coefficients A, B (and C for the quadratic), the regression equation, and the correlation coefficient r.
The formula
Most models are linearized: with transformed variables X and Y and weights \(w=f\), compute \(N=\Sigma w\), then $$S_{xx}=\Sigma w X^{2}-\frac{(\Sigma w X)^{2}}{N},\quad S_{yy}=\Sigma w Y^{2}-\frac{(\Sigma w Y)^{2}}{N},\quad S_{xy}=\Sigma w X Y-\frac{(\Sigma w X)(\Sigma w Y)}{N}.$$ The slope \(b=\frac{S_{xy}}{S_{xx}}\), intercept \(a=\bar{Y}-b\cdot\bar{X}\), and \(r=\frac{S_{xy}}{\sqrt{S_{xx}\cdot S_{yy}}}\). Coefficients A,B are back-transformed per model. The quadratic \(y=A+Bx+Cx^{2}\) is fit by solving the weighted 3\(\times\)3 normal equations, and its r is the multiple correlation \(\sqrt{R^{2}}\).
Worked example
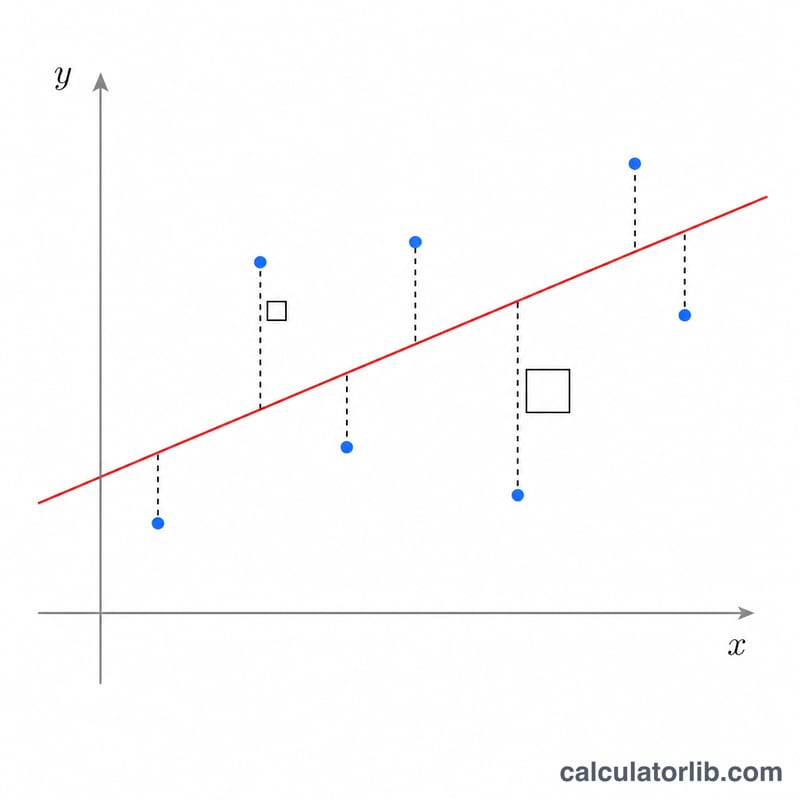
Linear model with rows (1,2,1), (2,3,2), (3,5,1): \(N=4\), \(\Sigma wx=8\), \(\Sigma wy=13\), \(\Sigma wx^{2}=18\), \(\Sigma wxy=29\), \(\Sigma wy^{2}=47\). Then \(S_{xx}=2\), \(S_{xy}=3\), \(S_{yy}=4.75\), so \(B=1.5\), \(A=0.25\), and $$r=\frac{3}{\sqrt{9.5}}=0.9733.$$ The fitted equation is $$y = 0.25 + 1.5\cdot x.$$
FAQ
What does the correlation coefficient mean? \(0.7<|r|\le 1\) strong, \(0.4<|r|<0.7\) moderate, \(0.2<|r|<0.4\) weak, \(0\le|r|<0.2\) none.
Why are some models rejected? Logarithmic and power need \(x>0\); e-exponential, ab-exponential and power need \(y>0\); inverse needs \(x\ne 0\) (because the transform uses \(\ln\) or \(1/x\)).
Does precision change the answer? No, it only changes how many digits are displayed.