

What the 401k Future Value Calculator Does
This calculator estimates how much your 401(k) — a United States employer-sponsored retirement account — could be worth by the time you retire. Using five simple inputs, it projects your future balance and breaks the result into how much you actually contributed versus how much you earned through investment growth.
The Inputs You Enter
- Current Age – your age today.
- Retirement Age – the age you plan to stop working. The gap between these two is your years until retirement.
- Current 401k Balance ($) – the amount already saved in your account.
- Annual Contribution ($) – the total dollars you (and any employer match) add each year.
- Expected Annual Return (%) – your assumed average yearly investment growth rate.
How the Formula Works
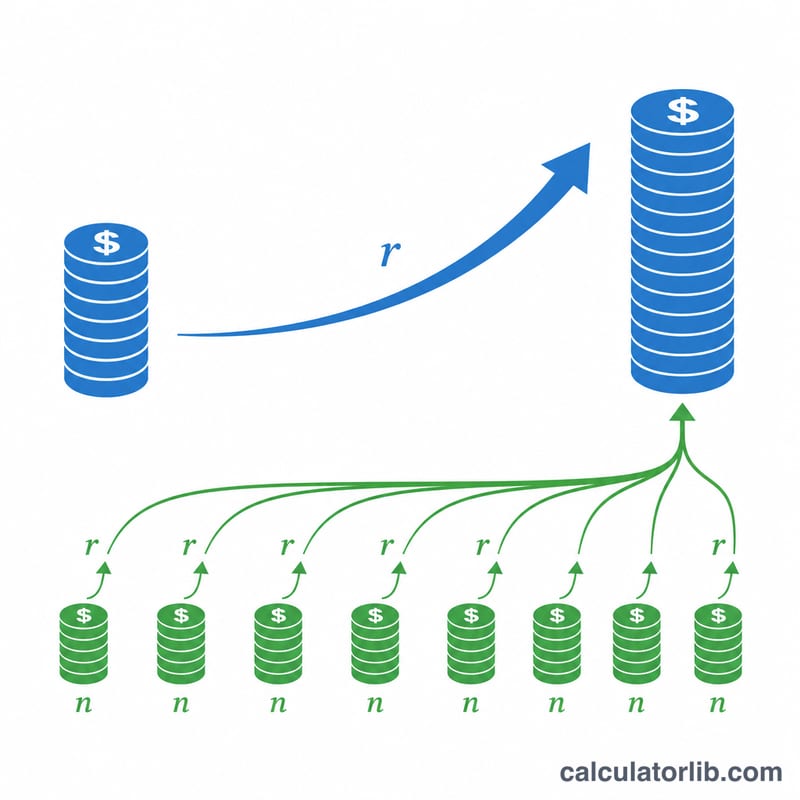
The calculator runs a year-by-year loop. Each year it adds your annual contribution to the running balance, then multiplies the total by (1 + return rate):
$$\text{balance} = (\text{balance} + \text{annual contribution}) \times (1 + \text{return})$$
This repeats once for every year until retirement. Because contributions are added at the start of each year, they earn growth in that same year. After the loop:
- Total Contributions = current balance + (annual contribution × years)
- Total Earnings = future value − total contributions
Worked Example
Suppose you are 30, retiring at 60, with a $50,000 balance, contributing $10,000 a year at a 7% expected return. That's 30 years of growth.
Each year the balance grows as \((\text{balance} + 10{,}000) \times 1.07\). After 30 iterations the future value reaches roughly $1,389,000. Your total contributions equal $$50{,}000 + (10{,}000 \times 30) = 350{,}000,$$ meaning around $1,039,000 comes purely from compounding earnings.
2024 IRS 401(k) Contribution Limits
The IRS sets annual limits on how much can be contributed to a 401(k). For tax year 2024, the relevant figures are below. The figures govern how large an annual contribution you can realistically enter in the calculator.
| Limit (Tax Year 2024) | Amount |
|---|---|
| Employee elective deferral limit (under age 50) | $23,000 |
| Catch-up contribution (age 50 and older) | $7,500 |
| Employee deferral including catch-up (age 50+) | $30,500 |
| Combined employee + employer limit (under 50) | $69,000 |
| Combined employee + employer limit (age 50+, with catch-up) | $76,500 |
The combined limit (officially the §415(c) limit) caps total additions — your deferrals plus employer match plus any after-tax contributions. These are statutory maximums; many savers contribute less, and employer matching counts toward the combined cap but not the individual deferral cap.
Interpreting Your Projected Balance
The projected balance is a nominal, pre-tax estimate. It expresses the account value in future dollars and assumes a single, constant rate of return every year — real markets vary, so treat the figure as a planning illustration rather than a guarantee.
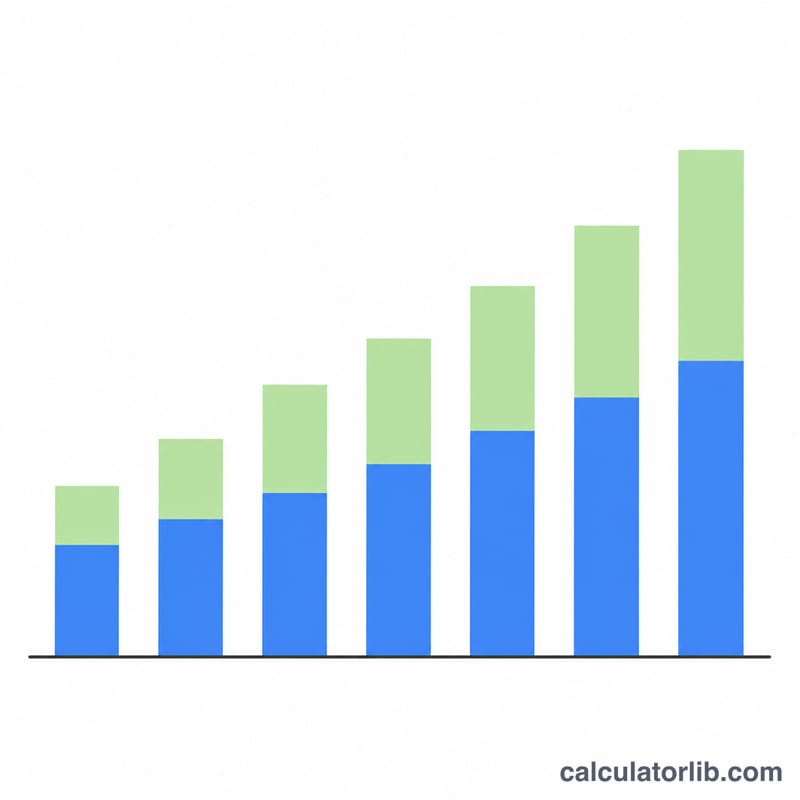
The split the calculator reports between total contributions and earnings reveals the role of compounding. Early in the time horizon, contributions dominate the balance; over longer periods, earnings (growth on prior growth) typically make up the larger share. In the age‑25, $10,000-per-year, 7% scenario above, the $400,000 contributed grows to over $2.1 million — earnings account for more than 80% of the final balance.
Two factors reduce the real-world usefulness of the headline number:
- Inflation erodes purchasing power. A balance of $1 million in 30 years buys far less than $1 million today, so it is useful to discount the nominal figure by an assumed inflation rate to see its value in today's dollars.
- Taxes apply to traditional (pre-tax) 401(k) withdrawals, which are taxed as ordinary income when distributed in retirement. The projected balance therefore overstates the spendable amount; Roth 401(k) balances, by contrast, are generally withdrawn tax-free if qualified.
This is general educational information and not personalized financial, tax, or investment advice.
Frequently Asked Questions
Does this include employer matching? Only if you build the match into the Annual Contribution field. Add your contribution plus your employer's match together for an accurate projection.
Is the return guaranteed? No. The expected return is an assumption. Markets fluctuate, so try several rates — for example 5%, 7% and 9% — to see a realistic range of outcomes.
Does it account for inflation or taxes? No. The figures are pre-tax, nominal dollars. Traditional 401(k) withdrawals are taxed as income in retirement, and inflation reduces real purchasing power, so treat the result as a gross estimate.