What this calculator does
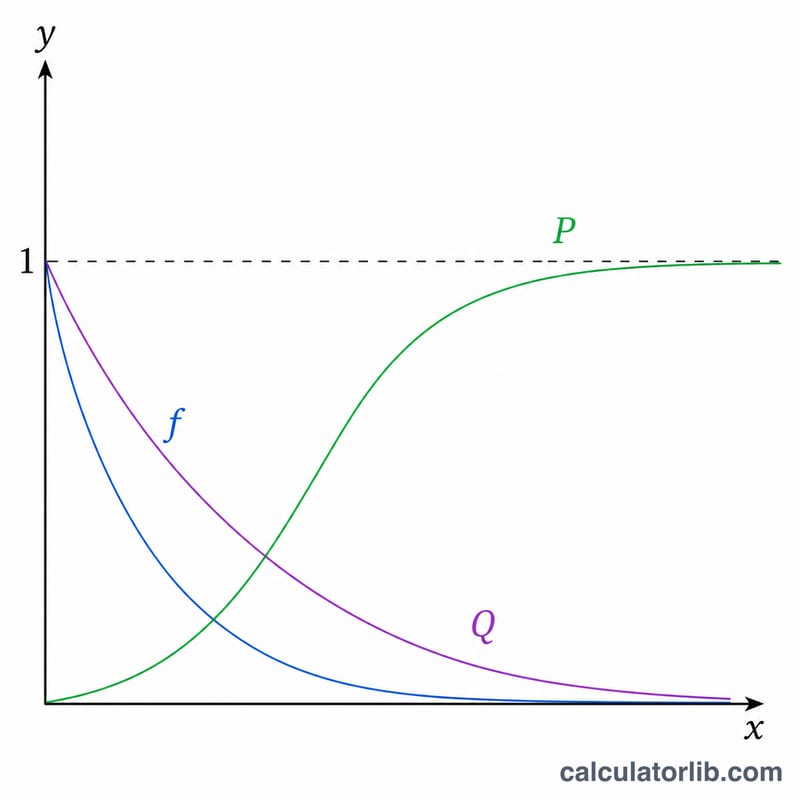
This is a universal, pure-mathematics statistics tool that evaluates the exponential distribution over a range of x values and returns a graph-ready table of (x, y) pairs. You can compute the probability density \(f(x)\), the lower cumulative probability \(P(x)\) (the CDF), or the upper cumulative probability \(Q(x)\) (the survival function). Because it is pure math, the results apply identically in any country or field of application.
The scale-parameter form
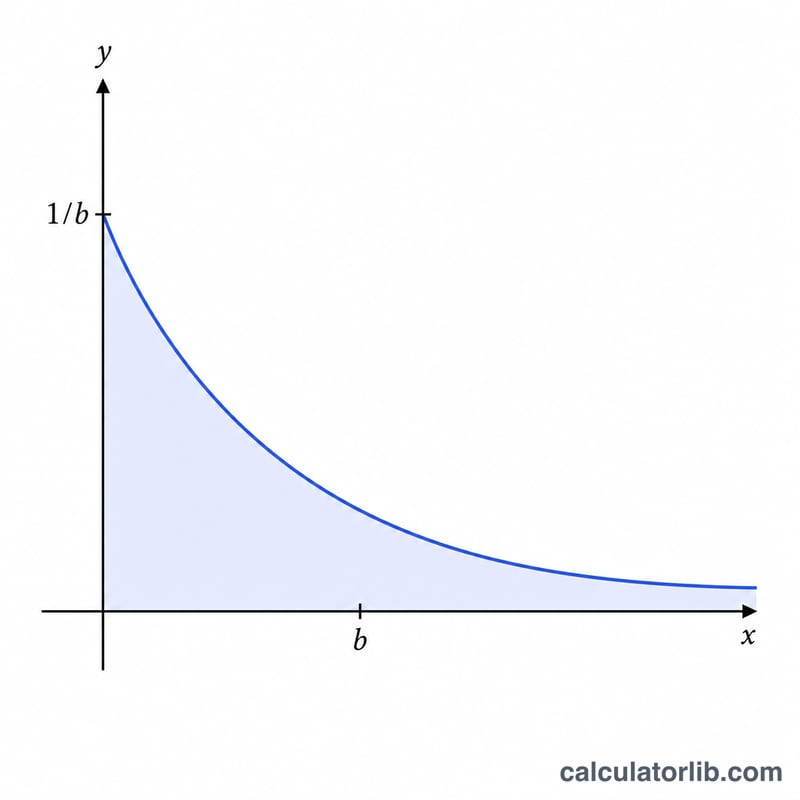
This tool uses the scale-parameter form \(b\) rather than the rate lambda. Here \(b\) is the mean of the distribution and the rate is \(\lambda = 1/b\). The density is $$f(x,b) = \frac{1}{b}\, e^{-x/b}$$ the CDF is $$P(x,b) = 1 - e^{-x/b}$$ and the survival function is $$Q(x,b) = e^{-x/b}$$ They satisfy \(P(x,b) + Q(x,b) = 1\) for every valid x. The distribution is defined for \(x \ge 0\) and \(b > 0\).
How to use it
Pick a function (density, lower cumulative, or upper cumulative). Enter the scale parameter \(b\) (the mean, must be positive), the initial value of x (must be zero or greater), the increment added each row, and the number of repetitions (rows). The table starts at the initial x and adds the increment for each successive row.
Worked example
With function = density, \(b = 2\), initial x = 0, increment = 0.1, and 101 rows: the first row gives \(f(0) = \frac{1}{2}e^0 = 0.5\). At \(x = 1.0\), $$f = 0.5 \cdot e^{-0.5} = 0.303265$$ At \(x = 2.0\), $$f = 0.5 \cdot e^{-1} = 0.183940$$ The final row (\(x = 10.0\)) gives $$f = 0.5 \cdot e^{-5} = 0.003369$$ Switching to the lower cumulative at \(x = 2\) gives \(P = 1 - e^{-1} = 0.632121\), and the upper cumulative gives \(Q = e^{-1} = 0.367879\), which sum to 1.
FAQ
Is b the mean or the rate? \(b\) is the mean (scale parameter). The rate lambda is \(1/b\), so a larger b means events occur less frequently.
Why must x be at least 0? The exponential distribution has support only on non-negative x; for \(x < 0\) the density is 0, P is 0 and Q is 1.
What if I set the increment to 0? Every row will share the same x value. This is allowed but usually you want a positive increment to trace a curve.


