What This Calculator Does
When you retire or leave a job with a defined-benefit pension, you may be offered a choice: keep a guaranteed annual pension for life, or take a one-time lump sum today. This calculator converts your annual pension into a present-value lump sum equivalent so you can compare it directly to the cash offer. This tool is a general financial estimate and is not tax or investment advice; pension rules vary by country and plan.

How to Use It
Enter your annual pension payment (the total you would receive each year), a discount rate (the rate of return you could reasonably earn elsewhere, e.g. 4–6%), and the lump sum your plan is offering. The calculator shows the equivalent value of the pension stream and tells you which option is worth more on paper.
The Formula Explained
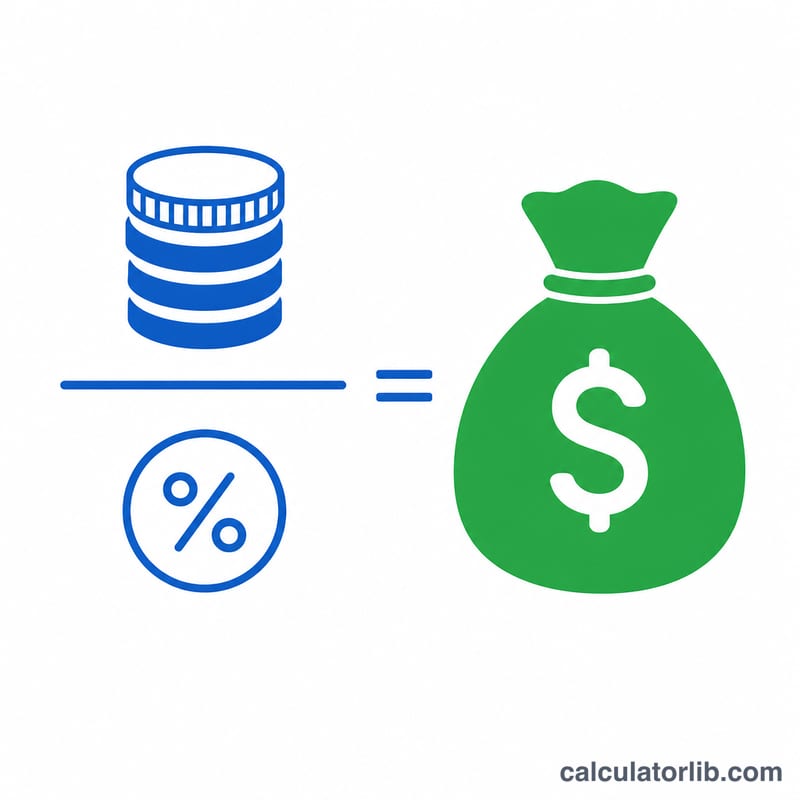
A lifelong pension behaves like a perpetuity — a stream of equal payments that never ends. The present value of a perpetuity is simply the annual payment divided by the discount rate:
$$\text{Lump Sum Equivalent} = \frac{\text{Annual Pension}}{\text{Discount Rate}/100}$$
A higher discount rate lowers the pension's present value (because money today is worth more), making the lump sum relatively more attractive.
Worked Example
Suppose your pension pays $30,000 per year and you use a 5% discount rate. The lump sum equivalent is $$\$30{,}000 \div 0.05 = \$600{,}000$$ If the plan offers only $450,000, the pension is worth $150,000 more, so keeping the pension is the stronger choice in pure value terms.
Life expectancy in United States
How long people in United States live on average from birth, compared with the world, from the World Bank.
- Life expectancy 2024
- 78.9 years
- World 2024
- 73.5 years
- Change since 1960
- +9.1 years
Latest change Up +0.5 years 2024: 78.9 years, against 78.4 years in 2023.
A child born in United States in 2024 can expect to live 78.9 years on average (world: 73.5 years).
| Year | United States | World |
|---|---|---|
| 2024 | 78.9 | 73.5 |
| 2020 | 77.0 | 72.2 |
| 2010 | 78.5 | 70.7 |
| 2000 | 76.6 | 67.7 |
| 1990 | 75.2 | 65.1 |
| 1980 | 73.6 | 62.2 |
| 1970 | 70.8 | 57.9 |
| 1960 | 69.8 | 50.9 |
Life expectancy at birth is an average for the whole population, not a personal prediction.
United States and other countries
Life expectancy at birth, in years — each country’s latest published year.
- Japan 84.0 years (2024)
- South Korea 83.6 years (2024)
- France 83.0 years (2024)
- Saudi Arabia 79.0 years (2024)
- United States 78.9 years (2024)
- China 78.0 years (2024)
- Türkiye 77.4 years (2024)
- Mexico 75.3 years (2024)
- Vietnam 74.7 years (2024)
- World 73.5 years (2024)
- Russia 73.4 years (2024)
- India 72.2 years (2024)
No published figure yet for Taiwan.
Years can differ between rows: each figure is shown with its own year. The same World Bank indicator for every country.
Latest figure: 2024 Data last updated 2026-10-18 · older figure
Source: The World Bank Group CC BY 4.0
Differences and changes are computed by CalculatorLib from these data.
Source details and methodology
- The World Bank Group — World Development Indicators (SP.DYN.LE00.IN)
FAQ
What discount rate should I use? Use a rate close to what you could earn on a low-to-moderate risk portfolio over the long term, often 4–6%. Higher rates favor the lump sum.
Does this account for inflation or life expectancy? No. This perpetuity model assumes payments continue indefinitely and ignores inflation, taxes, and survivor benefits. Treat it as a first-pass comparison.
Why might I still take the lump sum even if the pension is "worth more"? Lump sums offer flexibility, inheritance potential, and protection from plan default — factors this calculator does not price in.