
What the Profit Goal Calculator does
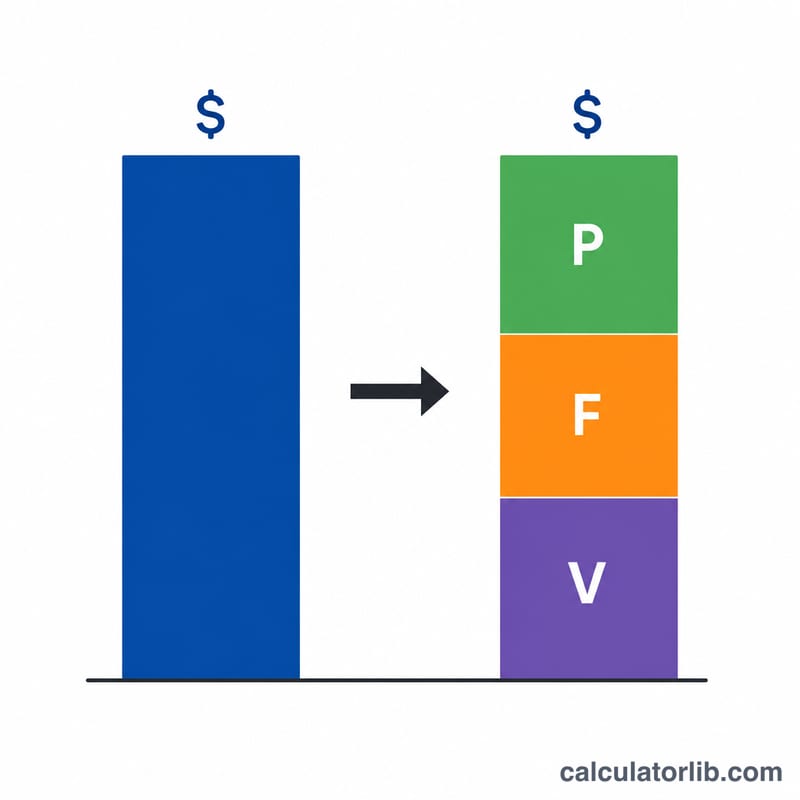
This calculator turns a business goal into the concrete numbers you need to hit it. Enter your current Sales, Profit, Variable Costs and Fixed Costs, then choose a goal — a target Profit, a target Sales level, or a target Variable Costs amount. The tool computes the full "Goal and Targets" set: the new Sales, Profit, Variable Costs and Fixed Costs required, all tied together by the income identity Sales = Profit + Variable Costs + Fixed Costs. Amounts are unit-agnostic currency figures, so they can represent a month, a quarter, a year, or a per-unit basis.
The key assumptions
Two things are held constant. First, Fixed Costs (F) stay the same — rent, salaries and overhead do not move when you grow. Second, your variable-cost ratio stays the same: \(\text{vRatio} = V / S\). This means pricing and margins are unchanged, so variable costs scale in proportion to sales. The contribution margin ratio is \(\text{cm} = 1 - \text{vRatio} = (S - V) / S\).
How to use it
Fill in your current figures (they should satisfy the identity; if you leave Variable Costs blank it is derived as \(S - P - F\)). Pick the goal variable from the dropdown and enter the goal amount. The calculator solves the remaining unknowns for you.
The formulas explained
For a profit goal: required sales = \((P_{goal} + F) / \text{cm}\), then \(V_{goal} = \text{vRatio} \times S_{goal}\). For a sales goal: \(V_{goal} = \text{vRatio} \times S_{goal}\) and \(P_{goal} = S_{goal} \times \text{cm} - F\). For a variable-cost goal: \(S_{goal} = V_{goal} / \text{vRatio}\), then \(P_{goal} = S_{goal} - V_{goal} - F\).
$$S_{goal} = \dfrac{P_{goal} + F}{1 - \frac{V}{S}}$$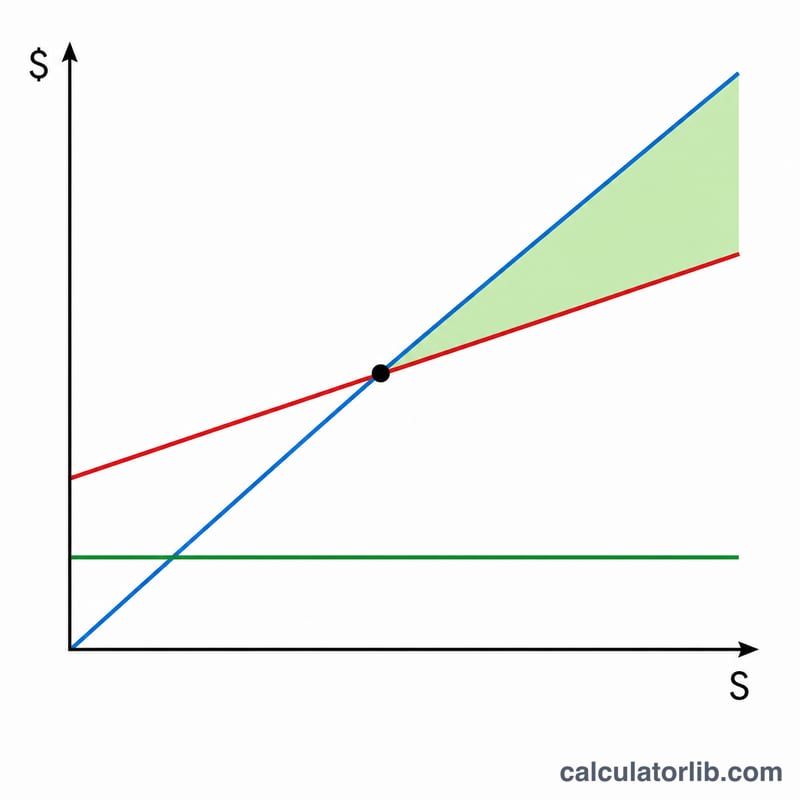
Worked example
Current \(S = 100{,}000\), \(P = 20{,}000\), \(V = 50{,}000\), \(F = 30{,}000\). Then \(\text{vRatio} = 0.5\) and \(\text{cm} = 0.5\). Goal: profit of 30,000. Required sales = $$(30{,}000 + 30{,}000) / 0.5 = 120{,}000.$$ Variable costs = \(0.5 \times 120{,}000 = 60{,}000\). Check: \(30{,}000 + 60{,}000 + 30{,}000 = 120{,}000\).
FAQ
Why does my profit goal need so much extra sales? Because only your contribution margin (cm) drops to the bottom line. With a 50% margin you need $2 of sales for every $1 of new profit plus fixed-cost coverage.
Can I model a loss? Yes — negative profit values are allowed for both current and goal figures.
When does it error? If current Sales is zero (no ratio can be found), if contribution margin is zero for a profit goal, or if variable costs are zero for a variable-cost goal.