What this calculator does
This tool estimates the lump sum of savings — your "nest egg" — needed to generate a chosen monthly income in retirement. It works by annualizing your desired monthly income and dividing by a safe annual withdrawal rate, the percentage of your portfolio you plan to draw each year.
How to use it
Enter the monthly income you want your savings to provide, then enter the annual withdrawal rate you consider sustainable. Many planners use the "4% rule" as a starting point, though more conservative savers prefer 3% to 3.5%. The result is the total savings needed at retirement.
The formula explained
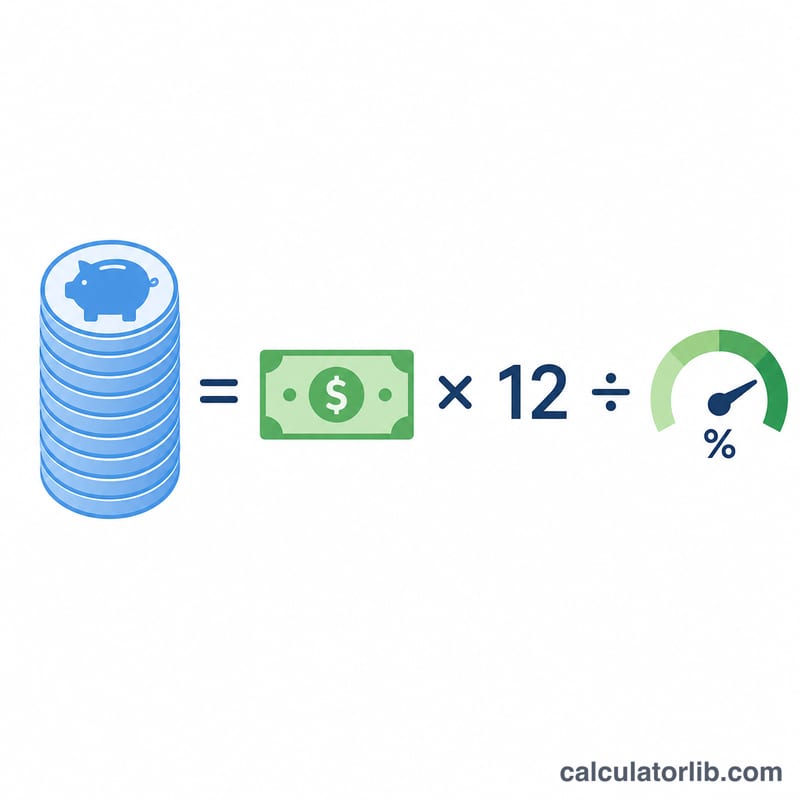
The calculation is $$\text{Nest Egg} = \frac{\text{Monthly Income} \times 12}{\text{Withdrawal Rate}}$$ Multiplying monthly income by 12 gives the annual income target. Dividing by the withdrawal rate (as a decimal) scales that up to the portfolio size required. A lower withdrawal rate demands a larger nest egg because you are drawing a smaller slice each year.
Worked example
Suppose you want $4,000 per month and assume a 4% withdrawal rate. Annual income is \(4{,}000 \times 12 = \$48{,}000\). Dividing by 0.04 gives $1,200,000. So you would need roughly $1.2 million saved to support that income under the 4% rule.
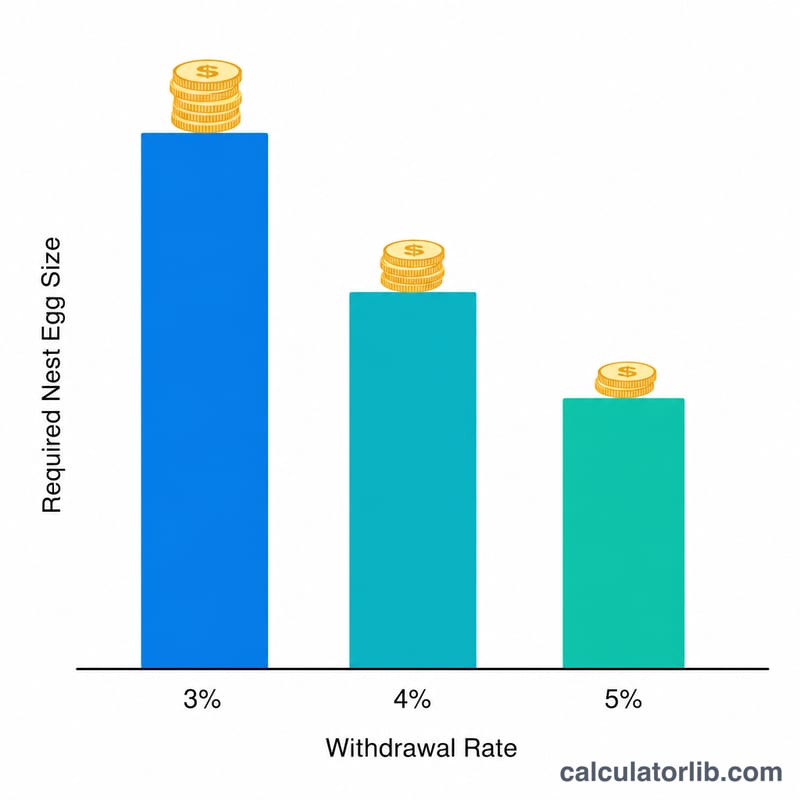
Nest Egg Needed at Different Withdrawal Rates and Incomes
The table shows the portfolio needed to fund each monthly income at each withdrawal rate, using \(\text{Savings Needed} = \frac{ \text{Monthly Income} \times 12}{\text{Rate}}\). Figures are before taxes and rounded to the nearest dollar.
| Monthly Income | Annual Income | 3% Rate | 3.5% Rate | 4% Rate | 5% Rate |
|---|---|---|---|---|---|
| $2,000 | $24,000 | $800,000 | $685,714 | $600,000 | $480,000 |
| $3,000 | $36,000 | $1,200,000 | $1,028,571 | $900,000 | $720,000 |
| $4,000 | $48,000 | $1,600,000 | $1,371,429 | $1,200,000 | $960,000 |
| $5,000 | $60,000 | $2,000,000 | $1,714,286 | $1,500,000 | $1,200,000 |
| $6,000 | $72,000 | $2,400,000 | $2,057,143 | $1,800,000 | $1,440,000 |
Because the required nest egg equals annual income × (1 ÷ rate), a 4% rate means 25× annual spending and a 3% rate means about 33.3×. For example, $2,000 a month at 4% is $24,000 × 25 = $600,000, while $4,000 a month at 3% is $48,000 × 33.33 ≈ $1,600,000.
Interpreting Your Result
The result is the portfolio size at which your chosen withdrawal rate produces your target income. Withdrawing the rate percentage of that portfolio in the first year gives exactly your desired annual income (monthly income × 12).
The rate and the required nest egg are inversely related. The multiple of annual income needed is:
$$\text{Multiple} = \frac{1}{\text{Rate}}$$
- 4% → 1 ÷ 0.04 = 25× annual income
- 3.5% → 1 ÷ 0.035 ≈ 28.6× annual income
- 3% → 1 ÷ 0.03 ≈ 33.3× annual income
Lowering the rate from 4% to 3% raises the required nest egg by about one third.
The 4% rule comes from historical US-market research, notably William Bengen's 1994 study and the later Trinity Study. These studies assumed a retirement of roughly 30 years, a portfolio mixing stocks and bonds, and withdrawals that rise each year with inflation. They reflect US market history and may not apply the same way to other countries or market conditions.
Keep these limits in mind:
- The result is before taxes. Withdrawals from some accounts may be taxable, so the after-tax income can be lower.
- It does not include other income such as Social Security or pensions, which would reduce the amount your portfolio must provide.
- Longer retirements or different market conditions may support different withdrawal rates.
This is general information only, not financial advice.
Key Terms
- Nest egg
- The total invested savings you hold at retirement, from which you draw income.
- Safe withdrawal rate
- The percentage of your starting portfolio you can withdraw each year with a reasonably low chance of running out of money over a given period.
- The 4% rule
- A guideline from historical US-market studies. It suggests withdrawing 4% of the starting portfolio in year one and adjusting that dollar amount for inflation each year after, over about 30 years.
- Annualized income
- A monthly amount converted to a yearly figure by multiplying by 12.
- Sequence-of-returns risk
- The risk that poor investment returns early in retirement, while you are withdrawing money, damage the portfolio more than the same returns would later on.
- Inflation-adjusted withdrawal
- A withdrawal that is increased each year by the inflation rate so its purchasing power stays about the same.
FAQ
What withdrawal rate should I use? The classic 4% rule is common, but lower rates (3–3.5%) give a bigger safety margin for long retirements.
Does this account for inflation? The withdrawal rate concept assumes inflation-adjusted withdrawals, but this calculator gives a present-day target and does not project future inflation.
Is this guaranteed? No. Withdrawal-rate rules are guidelines based on historical returns and do not guarantee your money will last; consult a financial professional.