這個計算器的功能
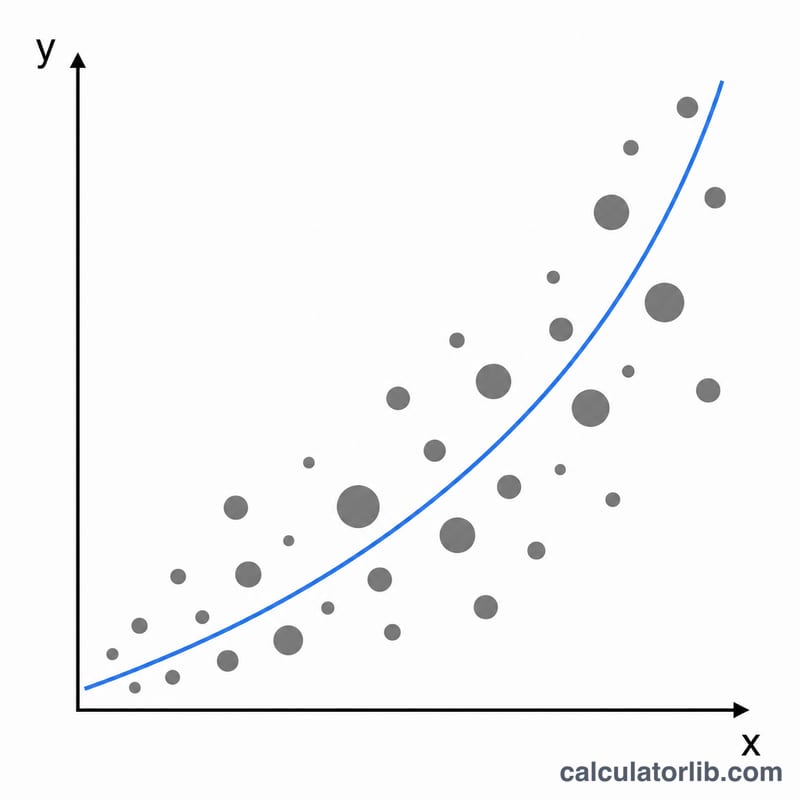
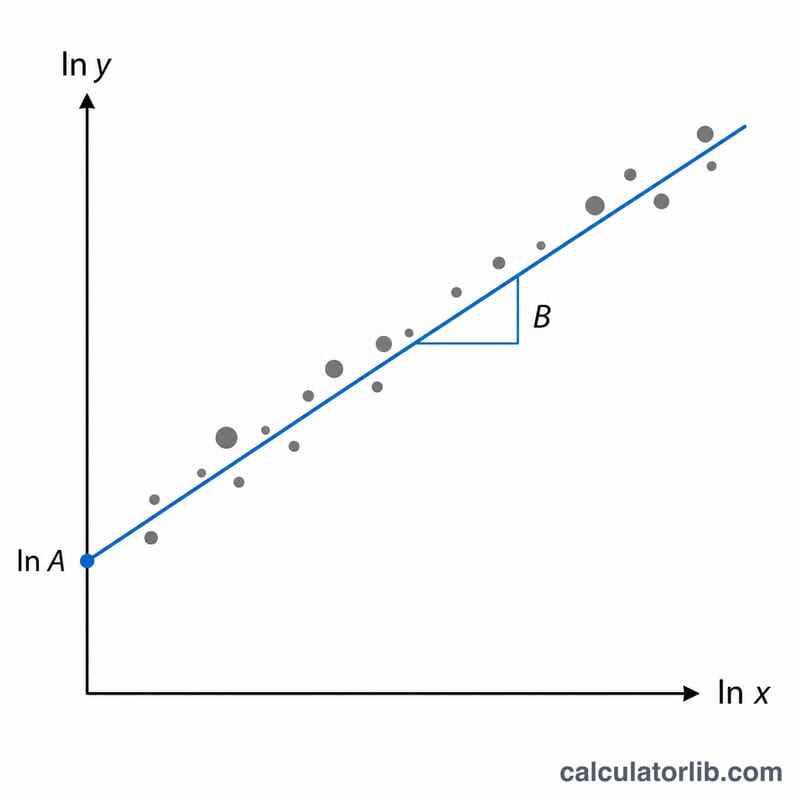
本工具能將一組資料點套配成 \(y = A\cdot x^{B}\) 形式的冪次趨勢線,其中每個點 (x, y) 都可以附帶一個頻率或權重 f。它的核心是在自然對數空間中進行的頻率加權最小平方迴歸,把冪次曲線轉換為一條直線 \(\ln y = \ln A + B\cdot\ln x\)。由於整個方法完全建立在數學與統計之上,沒有任何地區性規則,因此放諸四海皆準,任何地方都能使用。
使用方式
請以三組長度相同、並以逗號分隔的清單,分別輸入 x 值、y 值與頻率。所有 x 與 y 都必須為嚴格正數(因為零或負數沒有對數),每個頻率則須大於或等於零。接著選擇輸出結果要顯示的有效位數,即可讀出套配後的係數 A、指數 B,以及皮爾森相關係數 r。
公式說明
對每一列資料,令 \(X = \ln x\)、\(Y = \ln y\)。設總權重 \(n = \sum f\),則加權平均數為 \(\text{meanLnX} = \sum f\cdot\ln x / n\) 與 \(\text{meanLnY} = \sum f\cdot\ln y / n\)。加權平方和為 \(S_{xx} = \sum f(\ln x)^2 - n\cdot\text{meanLnX}^2\)、\(S_{yy} = \sum f(\ln y)^2 - n\cdot\text{meanLnY}^2\),以及 \(S_{xy} = \sum f(\ln x)(\ln y) - n\cdot\text{meanLnX}\cdot\text{meanLnY}\)。由此可得
$$y = A\,x^{B} \qquad B = \frac{S_{xy}}{S_{xx}}, \quad A = \exp\!\left(\overline{\ln y} - B\,\overline{\ln x}\right)$$\(B = S_{xy}/S_{xx}\)、\(A = \exp(\text{meanLnY} - B\cdot\text{meanLnX})\),\(r = S_{xy}/(\sqrt{S_{xx}}\cdot\sqrt{S_{yy}})\)。換句話說,每個點都等於被重複計算了 f 次。
實例演算
取 \(x = [1, 2, 3, 4, 5]\) 與 \(y = [1, 4, 9, 16, 25]\)(恰好就是 \(y = x^2\)),並將所有頻率設為 1。計算結果為 \(S_{xx} \approx 1.615494\)、\(S_{xy} \approx 3.230987\)、\(S_{yy} \approx 6.461972\),因此
$$B = \frac{3.230987}{1.615494} = 2, \quad A = \exp(0) = 1, \quad r = 1$$最終得到的 \(y = 1\cdot x^2\) 正是完美套配,與預期相符。
常見問題
相關係數代表什麼意思?\(|r|\) 越接近 1,代表冪次關係越強;0.4–0.7 屬於中等,0.2–0.4 偏弱,低於 0.2 則幾乎沒有關聯。
為什麼 x 與 y 一定要是正數?因為套配過程使用自然對數,而對數只對正數有定義,所以非正數的點會被略過。
如果所有 x 值都相同呢?此時 \(S_{xx} = 0\),指數 B 無法求出,計算器會回報錯誤。