
What This Calculator Does
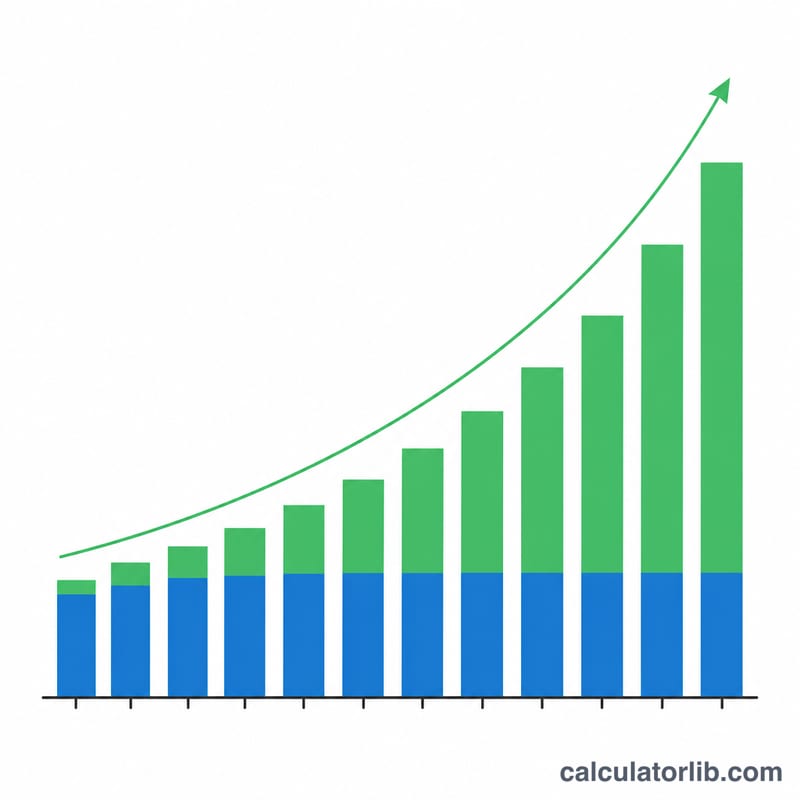
The Investment Growth Calculator projects how much an investment could be worth in the future when you combine an initial lump sum with regular annual contributions. It applies compound growth to both your starting balance and every yearly deposit, then shows how much of the final balance comes from the money you invested versus the interest your money earned.
How to Use It
Enter your initial investment (the lump sum you start with), your annual contribution (how much you add each year), the expected annual return rate as a percentage, and the number of years you plan to stay invested. The calculator returns the projected future value along with a breakdown of total contributions, total interest earned, and the growth attributable to each source.
The Formula Explained
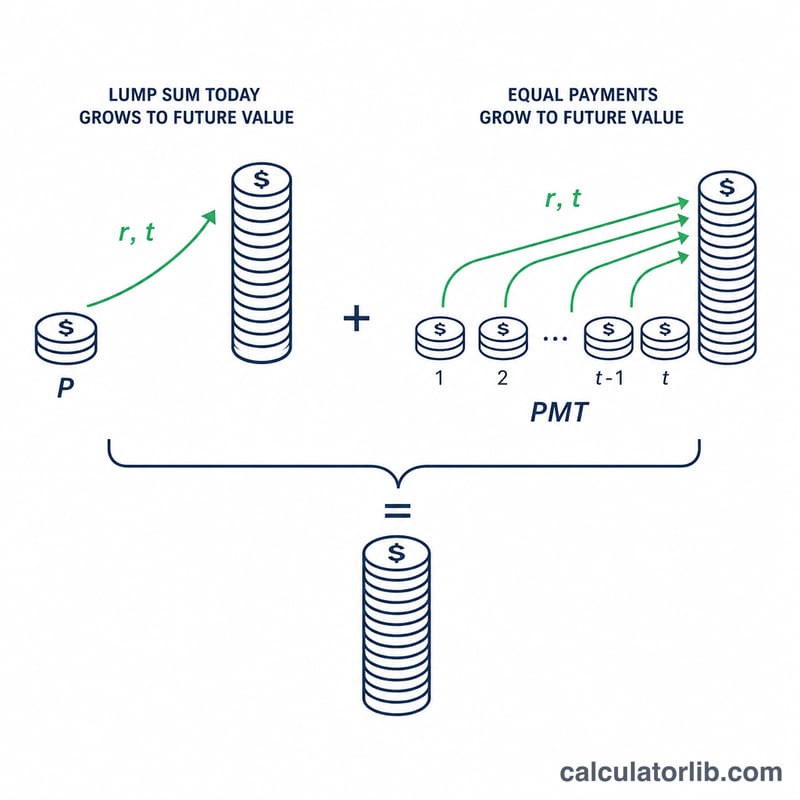
The future value is the sum of two parts. The lump sum grows by compound interest: \(P(1+r)^{t}\). The recurring contributions form an ordinary annuity and grow by \(PMT \times \left[\frac{(1+r)^{t} - 1}{r}\right]\). Here \(r\) is the annual rate written as a decimal (7% = 0.07) and \(t\) is the number of years. Contributions are assumed to be made at the end of each year and compounded annually.
$$FV = P\,(1+r)^{t} + PMT \cdot \frac{(1+r)^{t}-1}{r}$$$$\text{where}\quad \left\{ \begin{aligned} P &= \text{Initial Investment} \\ PMT &= \text{Annual Contribution} \\ r &= \dfrac{\text{Rate (\%)}}{100} \\ t &= \text{Years} \end{aligned} \right.$$
Worked Example
Suppose you invest a $10,000 lump sum, add $5,000 every year, expect a 7% annual return, and stay invested for 20 years. The growth factor \((1.07)^{20} \approx 3.8697\). The lump sum grows to about $38,697, and the contributions grow to roughly $204,977, for a total future value near $243,674. You contributed $110,000 in all, so about $133,674 is interest.
FAQ
Is the contribution monthly or annual? This tool uses annual contributions compounded once per year. For monthly investing, multiply your monthly amount by 12 as an approximation.
What return rate should I use? Long-term stock-market averages are often estimated around 6–8% before inflation, but returns are never guaranteed. Try a few rates to see a range of outcomes.
Does it account for taxes or inflation? No. The result is a nominal projection. Reduce the rate to model inflation-adjusted ("real") growth.