What Is Return on Assets (ROA)?
Return on Assets (ROA) is a profitability ratio that measures how efficiently a company uses its assets to generate profit. It tells you how many cents of net income the business earns for every dollar of assets it controls. A higher ROA means management is squeezing more profit out of the resources at its disposal.
How to Use This Calculator
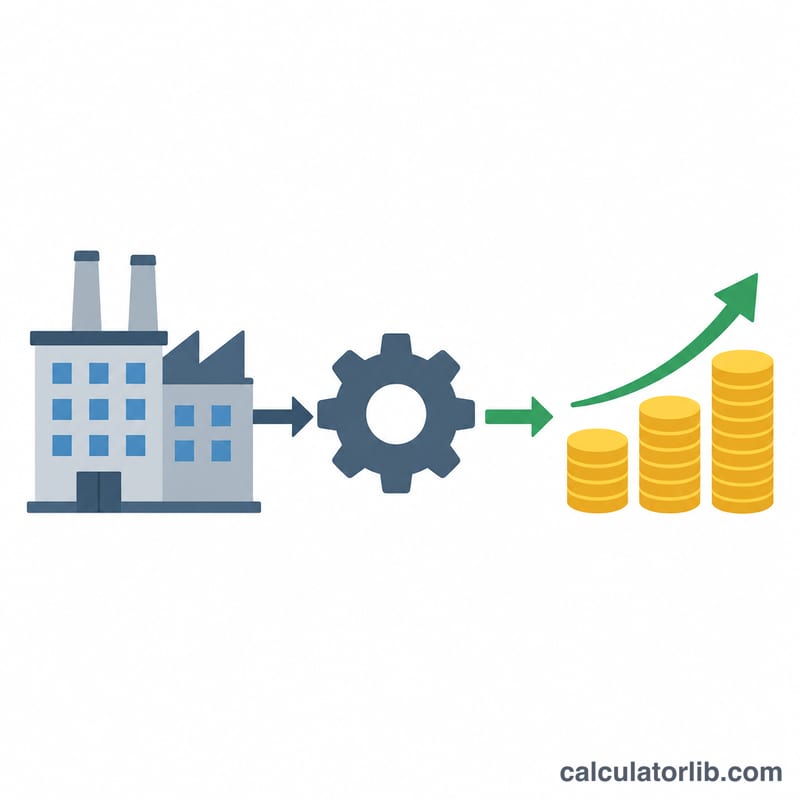
Enter the company's net income (the bottom-line profit after taxes and expenses, taken from the income statement) and its total assets (from the balance sheet). The calculator divides net income by total assets and multiplies by 100 to express the result as a percentage.
The Formula Explained
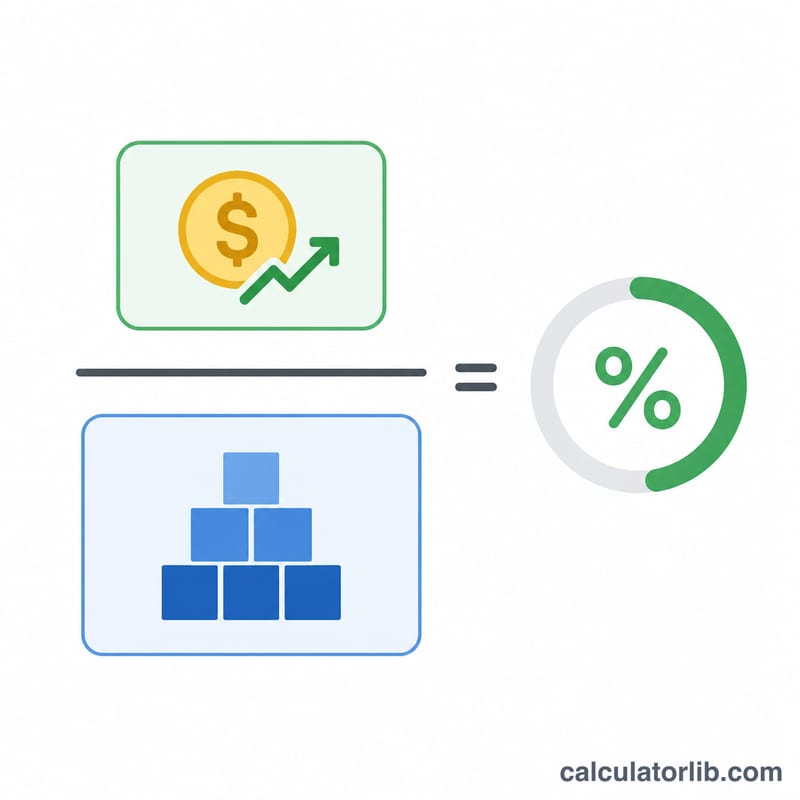
$$\text{ROA} \% = \frac{\text{Net Income}}{\text{Total Assets}} \times 100$$ Net income is the profit available to shareholders after all costs. Total assets includes everything the company owns — cash, receivables, inventory, property, and equipment. Many analysts use average total assets (beginning + ending, divided by two) for a more stable figure, but the period-end value is the common quick method used here.
Worked Example
Suppose a company reports net income of $50,000 and total assets of $500,000. $$\text{ROA} = \frac{50{,}000}{500{,}000} \times 100 = 10\%$$ This means the company generates 10 cents of profit for every dollar of assets — a solid result for many industries.
Typical ROA by Industry
The ranges below are rough, general approximations of what net income divided by total assets often looks like in each sector. Actual figures vary by year, economic cycle, country, accounting standard and data source, so treat them as orientation only. Compare a company with its direct peers of similar size, business model and region, and do not treat these ranges as targets.
| Sector | Approximate typical ROA range | Why |
|---|---|---|
| Banks and lenders | about 0.5%–1.5% | Balance sheets are very large relative to profit and funded mostly by deposits and debt |
| Utilities | about 2%–4% | Very asset-intensive (plants, grids) with regulated returns |
| Oil and gas | about 2%–10%, can be negative | Capital-heavy and highly cyclical with commodity prices |
| Manufacturing | about 4%–8% | Plant, equipment and inventory keep the asset base large |
| Retail | about 3%–8% | Thin margins offset by fast asset turnover |
| Software / technology | about 8%–20% or more | Asset-light, high margins, though large cash or goodwill balances can pull ROA down |
Individual companies can fall well outside these ranges, especially in years with unusual gains, losses or acquisitions.
Interpreting Your ROA Result
ROA shows how many cents of net income a company earns per dollar (or other currency unit) of total assets. The bands below are general rules of thumb, and the right benchmark depends on how asset-intensive the industry is.
- Negative: the company posted a net loss for the period.
- Below about 5%: generally considered low, though normal for banks, utilities and other asset-heavy businesses.
- Roughly 5%–10%: moderate, and often acceptable in many industries.
- Above about 10%–20%: generally strong, especially outside asset-light sectors. Sustained high figures often reflect high margins or very efficient asset use.
What can distort ROA
- Asset intensity: capital-heavy firms naturally show lower ROA than asset-light ones, so cross-industry comparisons mislead.
- Leverage: ROA uses total assets regardless of how they are financed. Net income is after interest, so heavy debt can reduce ROA, while ROE can look inflated.
- One-off items: asset sales, impairments, legal settlements or tax effects can swing net income and make a single year unrepresentative.
- Timing of assets: using year-end total assets instead of the average over the period can distort ROA for fast-growing or shrinking firms.
The DuPont link
ROA can be split into profitability and efficiency:
$$\text{ROA} = \frac{\text{Net income}}{\text{Revenue}} \times \frac{\text{Revenue}}{\text{Total assets}} = \text{Net margin} \times \text{Asset turnover}$$
A company can reach the same ROA through high margins and slow turnover (e.g. luxury goods) or low margins and fast turnover (e.g. grocery retail). This is general educational information, not financial advice.
ROA Scenario Comparison
The companies below are hypothetical and use the formula \(\text{ROA} = \frac{\text{Net income}}{\text{Total assets}} \times 100\%\).
| Scenario | Net income | Total assets | ROA |
|---|---|---|---|
| Asset-light software firm | $20,000,000 | $100,000,000 | 20.0% |
| Asset-heavy manufacturer | $15,000,000 | $300,000,000 | 5.0% |
| Same profit, larger asset base | $15,000,000 | $600,000,000 | 2.5% |
| Mid-size retailer | $9,000,000 | $150,000,000 | 6.0% |
| Loss-making startup | -$4,000,000 | $25,000,000 | -16.0% |
Example: for the manufacturer, \(\frac{15{,}000{,}000}{300{,}000{,}000} \times 100\% = 5.0\%\). Doubling the asset base while keeping profit unchanged halves ROA to 2.5%, showing how asset growth must be matched by profit growth to maintain returns. Results are illustrative and not a judgment on any real company.
FAQ
What is a good ROA? It varies by industry. Asset-heavy sectors like utilities may show low single-digit ROAs, while software firms can post 15%+. Compare against peers rather than an absolute number.
How does ROA differ from ROE? ROA measures profit against all assets; Return on Equity (ROE) measures profit against shareholders' equity only, which excludes debt-financed assets.
Can ROA be negative? Yes. If a company has a net loss, net income is negative, producing a negative ROA — a sign the business is destroying value relative to its asset base.