What Is Maximum Drawdown?
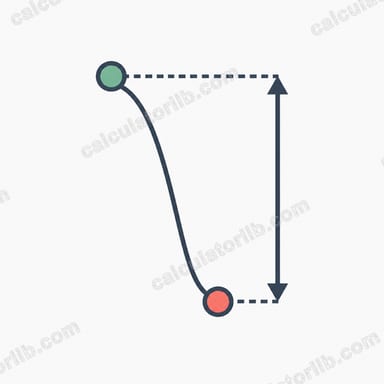
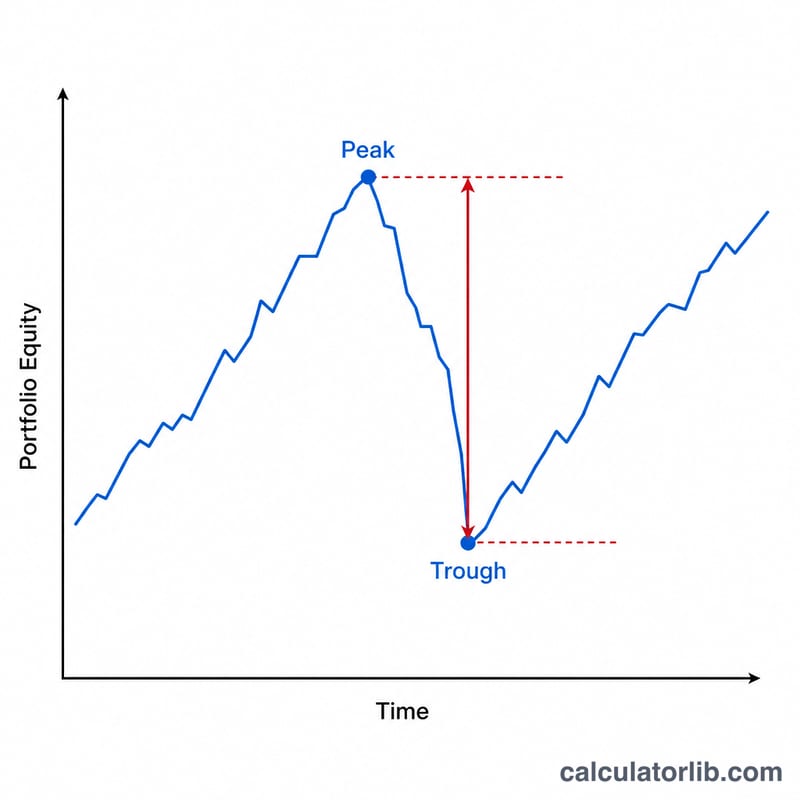
Maximum drawdown (MDD) measures the largest observed loss from a peak to a subsequent trough of an investment, portfolio, or fund before a new peak is reached. It is one of the most widely used risk metrics because it captures downside risk in a way investors intuitively understand: "how much could I have lost from the top?" A lower maximum drawdown generally indicates a less volatile, less risky investment.
How to Use This Calculator
Enter the highest value your portfolio reached (the peak) and the lowest value it fell to afterward (the trough). The calculator instantly returns the drawdown as a percentage of the peak, along with the absolute loss amount. Use account statement highs and lows, or pull the values from a price chart.
The Formula Explained
The maximum drawdown is calculated as:
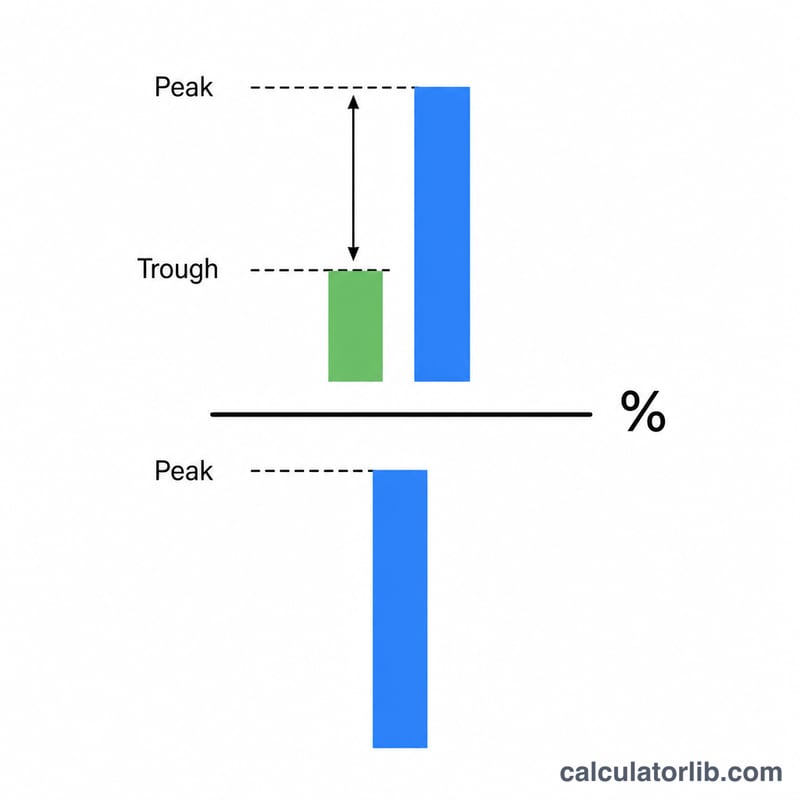
$$\text{MDD} = \frac{\text{Peak} - \text{Trough}}{\text{Peak}} \times 100\%$$
The numerator is the dollar (or unit) loss, and dividing by the peak normalizes it so drawdowns of different sizes can be compared. The result is always expressed as a percentage of the high-water mark.
Worked Example
Suppose your portfolio peaked at $10,000 and later dropped to a low of $7,500. The drawdown amount is \(\$10{,}000 - \$7{,}500 = \$2{,}500\). As a percentage: $$\$2{,}500 \div \$10{,}000 \times 100 = 25\%$$ That means you experienced a 25% maximum drawdown — your portfolio would need to gain 33.3% from the trough just to return to its old peak.
Interpreting Your Maximum Drawdown
Maximum drawdown (MDD) answers one narrow question: across the period you measured, what was the largest percentage fall from a running peak to the lowest point reached before a new peak was set? It is computed from the formula
$$\text{MDD} = \frac{\text{Peak} - \text{Trough}}{\text{Peak}} \times 100\%$$A portfolio that climbed to a high of $250,000 and later bottomed at $175,000 has a maximum drawdown of 30%, because \((250{,}000 - 175{,}000) \div 250{,}000 = 0.30\).
Rough magnitude bands
These bands are descriptive conventions used in portfolio reporting, not rules or thresholds set by any regulator:
| Maximum drawdown | What it typically represents |
|---|---|
| Under 10% | Mild; routine fluctuation for most diversified multi-asset portfolios |
| 10% – 20% | "Correction" territory — a decline of 10% or more is conventionally called a correction in equity markets |
| 20% – 40% | Bear-market scale; a fall of 20% or more from a peak is the common definition of a bear market |
| 40% – 50% | Severe; typical of concentrated equity or leveraged exposure in a major crisis |
| Over 50% | Severe capital impairment — more than half the peak value is gone and the arithmetic of recovery becomes punishing |
The gain needed to get back to the high-water mark
Recovery is asymmetric: the percentage gain required is always larger than the percentage lost, because the gain is earned on the smaller surviving balance. With MDD expressed as a decimal \(d\):
$$\text{Required gain} = \frac{d}{1 - d} \times 100\%$$| Maximum drawdown | Remaining value per 100 at peak | Gain required to return to the peak |
|---|---|---|
| 10% | 90 | 11.1% |
| 20% | 80 | 25.0% |
| 30% | 70 | 42.9% |
| 40% | 60 | 66.7% |
| 50% | 50 | 100.0% |
| 75% | 25 | 300.0% |
| 90% | 10 | 900.0% |
Worked check at 30%: \(0.30 \div (1 - 0.30) = 0.30 \div 0.70 = 0.4286\), i.e. 42.9%. In the earlier example, the $175,000 trough must grow by 42.9% to regain $250,000.
Single asset versus diversified portfolio
An MDD measured on one security is a property of that security's own price path. An MDD measured on a portfolio is a property of the combined value path, and it is normally smaller than the weighted average of its holdings' individual drawdowns, because the components rarely reach their worst points on the same day. That gap is the observed diversification benefit over the sample — it is not guaranteed, and correlations between asset classes have historically risen during acute market stress, which compresses the benefit precisely when it is most wanted. Note also that a portfolio MDD computed from values that include deposits or withdrawals mixes cash flow with performance; for a performance measure, use a return-based or unit-value series instead.
What maximum drawdown does not tell you
- It is path-dependent. Two portfolios with identical start and end values, and even identical average returns, can have very different MDDs depending on the order in which the returns arrived.
- It depends on the measurement window. Extending the sample period can only leave MDD unchanged or increase it — never decrease it, since a longer window contains every peak–trough pair the shorter one did, plus more. A "5-year maximum drawdown" and a "20-year maximum drawdown" are therefore not comparable figures, and MDDs compared across funds should always cover the same dates.
- It depends on the data frequency. Drawdowns computed from month-end values are typically smaller than those computed from daily closes, because intra-month troughs are invisible to monthly data.
- It ignores duration and frequency. MDD is a single worst-case depth. It says nothing about how long the portfolio stayed underwater, how long recovery took, or whether there were two such episodes or twenty. Drawdown duration, time-to-recovery, average drawdown and the Ulcer Index exist to fill those gaps.
- It is backward-looking. MDD is a realised historical statistic, not a forecast or a limit. A future decline can exceed any past maximum, and a single extreme event can permanently redefine the number.
- It is one observation. Because MDD is an extreme value, it is estimated from essentially one episode in the sample, which makes it statistically noisy and sensitive to a handful of data points.
This section explains how the statistic behaves; it is general educational information about a calculation, not investment advice or a recommendation about any portfolio.
Historical Maximum Drawdowns of Major Markets
The figures below are for the S&P 500, a United States large-capitalisation equity index, measured on its price level in nominal US dollars. They are the most frequently cited reference points for equity drawdown magnitude, but they describe one country's stock market and should not be read as representative of global, emerging-market, bond or multi-asset portfolios, whose drawdown histories differ. For the pre-1957 period the index's predecessor series (the S&P 90 composite) is used, as is standard practice.
| Episode | Approximate peak | Approximate trough | Decline (price index) | Approximate time from trough back to the prior peak |
|---|---|---|---|---|
| Great Depression | September 1929 | June–July 1932 | about −86% | about 22 years (prior peak regained in 1954) |
| 1973–74 bear market (oil shock, stagflation) | January 1973 | October 1974 | about −48% | about 6 years in nominal price terms (1980); far longer after inflation |
| Black Monday crash | August 1987 | December 1987 | about −34% | about 1.5–2 years (1989) |
| Dot-com bust | March 2000 | October 2002 | about −49% | about 4.5 years (2007) |
| Global Financial Crisis | October 2007 | March 2009 | about −57% | about 4 years (2013) |
| COVID-19 crash | 19 February 2020 | 23 March 2020 | about −34% | about 5 months (August 2020) |
| 2022 inflation and rate-shock bear market | January 2022 | October 2022 | about −25% | about 15 months (January 2024) |
The 2020 episode is a good illustration of why depth and duration must be read separately: its roughly 34% fall matched the depth of 1987, but it unfolded over about a month and recovered within months, whereas the 1929–32 drawdown took more than two decades to recover in nominal terms.
Applying the formula to the Global Financial Crisis using exact closing levels — an index peak of 1,565.15 on 9 October 2007 and a closing trough of 676.53 on 9 March 2009 — gives 56.78%, which is why the episode is quoted as roughly −57%.
How to read these numbers
- All declines are approximations of index price levels, rounded to the nearest percent, and published values vary by a point or two between data sources.
- Figures differ depending on whether dividends are included. Total-return drawdowns are shallower than price-only drawdowns, and recoveries are correspondingly faster, because reinvested dividends add to the recovering balance.
- Figures also differ depending on whether daily closing prices, intraday extremes, or month-end values are used. Intraday-based measures give the deepest numbers; month-end measures the shallowest.
- All figures here are nominal. Adjusting for inflation materially lengthens several recoveries, most notably the 1973–74 episode.
- Peak and trough dates are commonly quoted to the day for recent episodes and to the month for older ones, reflecting the granularity of the underlying historical data.
- These are realised historical outcomes for one index over specific windows. As noted above, drawdown statistics grow with the length of the measurement period and are not predictions of future declines.
Key Terms and Variables
A note on sign convention before the definitions: maximum drawdown is reported both as a positive percentage of loss (MDD = 57%) and as a negative return (−57%), depending on the publisher. The magnitude is identical; only the sign differs. Ratios that divide a return by MDD — Calmar, MAR — always use the positive magnitude in the denominator, otherwise the sign of the ratio flips.
| Term | Definition | Formula / units |
|---|---|---|
| Peak | The highest portfolio or price value reached up to a given point in the series; the starting value of a drawdown. | Currency or index points |
| Trough | The lowest value reached after a peak and before a new peak is set; the end point of that drawdown. | Currency or index points |
| High-water mark | The running (cumulative) maximum of the value series — the highest value achieved so far. Drawdown is always measured from the high-water mark, never from an arbitrary starting value. In hedge-fund fee terms it is also the level above which performance fees can be charged again. | \(H_t = \max(V_1,\dots,V_t)\) |
| Drawdown | The percentage decline of the current value below the high-water mark at any single point in time. A series has many drawdowns. | \(D_t = \frac{H_t - V_t}{H_t} \times 100\%\) |
| Maximum drawdown (MDD) | The largest of all those drawdowns over the measurement period — the single deepest peak-to-trough loss. | \(\text{MDD} = \max_t D_t\); percent |
| Current drawdown | The drawdown as of the latest observation, i.e. how far below the all-time high the portfolio stands today. Zero when the portfolio is at a new high. | \(D_{\text{today}}\); percent |
| Average drawdown | The mean drawdown depth, computed either across all observations or across the identified drawdown episodes (state which). Complements MDD by describing the typical, not the worst, decline. | \(\overline{D} = \frac{1}{N}\sum_{i=1}^{N} D_i\); percent |
| Drawdown duration | The elapsed time from the peak to the trough — how long the decline itself lasted. | Days, months or years |
| Underwater period | The full span during which the value sits below the prior high-water mark: peak → trough → recovery. An "underwater curve" plots \(D_t\) over time and is zero whenever a new high is set. | Days, months or years |
| Recovery / time-to-recovery | The time from the trough until the prior peak is regained. Often quoted instead as time from peak to recovery; the two differ by the drawdown duration, so always check which is meant. | Days, months or years |
| Required recovery gain | The percentage rise from the trough needed to return to the high-water mark; always larger than the drawdown itself. | \(\frac{d}{1 - d}\), with \(d\) the drawdown as a decimal |
| Calmar ratio | Return per unit of worst-case drawdown: annualised (compound) return divided by maximum drawdown. Conventionally computed over a trailing 36-month window. Higher is better; it is unitless. | \(\text{Calmar} = \frac{R_{\text{ann}}}{\text{MDD}}\) |
| MAR ratio | The same construction as Calmar but applied to the entire available track record rather than a fixed trailing window: compound annual return divided by maximum drawdown over that full history. Unitless. | \(\text{MAR} = \frac{\text{CAGR}}{\text{MDD}}\) |
| Ulcer Index | The root-mean-square of the drawdown series, so it penalises both the depth and the persistence of being underwater — unlike MDD, which captures depth only. Expressed in percentage points; lower is better. | \(\text{UI} = \sqrt{\frac{1}{N}\sum_{i=1}^{N} D_i^{2}}\) |
| Volatility (standard deviation) | The dispersion of periodic returns around their mean. It treats upside and downside moves alike and is path-independent, which is exactly why it is not a substitute for drawdown. Periodic figures are annualised by multiplying by \(\sqrt{m}\), where \(m\) is periods per year (12 monthly, 252 trading days). | \(\sigma = \sqrt{\frac{1}{n-1}\sum (r_i - \bar{r})^{2}}\); percent per period or per year |
| Value at Risk (VaR) | The loss threshold that is expected to be exceeded only with a stated probability over a stated horizon — e.g. a 1-day 95% VaR of 2% means a worse single-day loss is expected about 5% of the time. It is a single-period, probabilistic estimate, whereas MDD is a realised multi-period outcome, and it says nothing about how large losses are once the threshold is breached. | Quoted as a percentage of value or a currency amount, with a confidence level and horizon |
Two practical cautions. First, every quantity above is sample-dependent: it is defined only with respect to the dates, data frequency and (for portfolios) the value series used, so quoted figures are comparable only on matching inputs. Second, this glossary is general educational information about how these measures are defined and computed — it is not financial or investment advice, and no figure here should be treated as a target, a limit or a recommendation for any particular portfolio.
FAQ
Is a higher or lower drawdown better? Lower is better. A smaller maximum drawdown means the investment lost less value at its worst point.
How is drawdown different from volatility? Volatility measures overall fluctuation in both directions, while drawdown focuses only on the worst peak-to-trough decline — pure downside risk.
Why does recovery require a bigger gain than the drawdown? Because the gain is calculated off the lower trough value. A 25% loss needs a 33% gain to break even, since \(7{,}500 \times 1.333 \approx 10{,}000\).