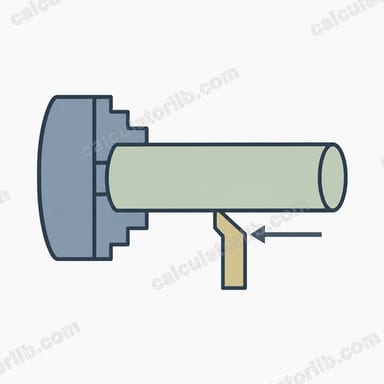
What this calculator does
This tool estimates the theoretical (geometric) surface roughness left by a milling cutter with a round nose, such as a ball-end mill or a round insert. It combines two effects: the feed marks along the tool path and the scallops (cusps) between neighbouring passes. It then compares the governing Ra with your required finish and tells you the maximum feed per tooth and stepover that would still meet it.
How to use it
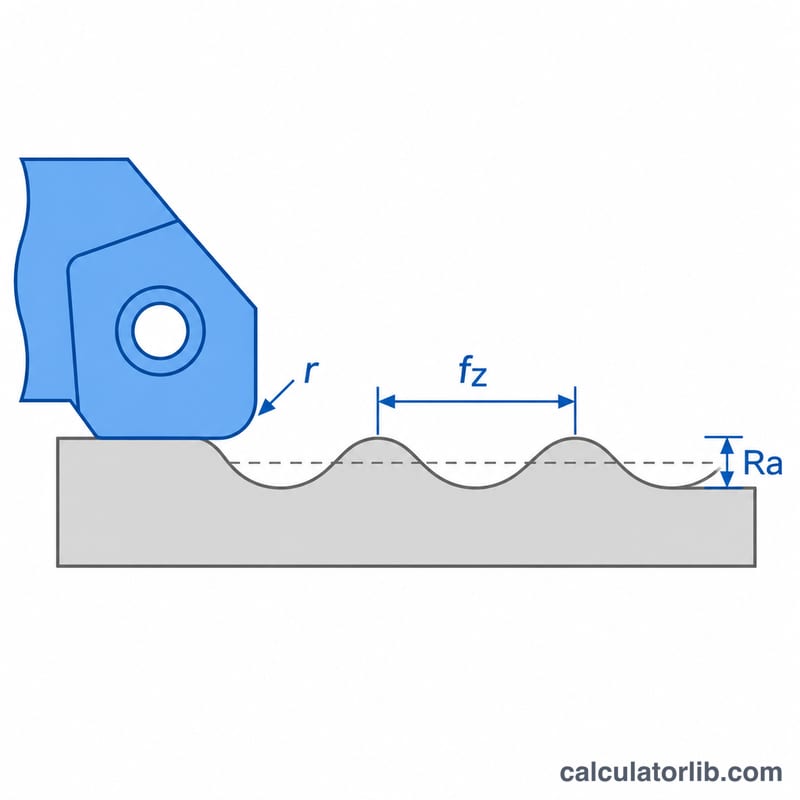
Enter the feed per tooth in mm, the radial stepover in mm, the cutter or insert radius in mm (4 mm for an 8 mm ball-end), and the required Ra in µm. The result shows the feed-direction Rt and Ra, the scallop height, the governing Ra, and a pass/fail verdict.
The formulas
Feed marks give a peak-to-valley height:
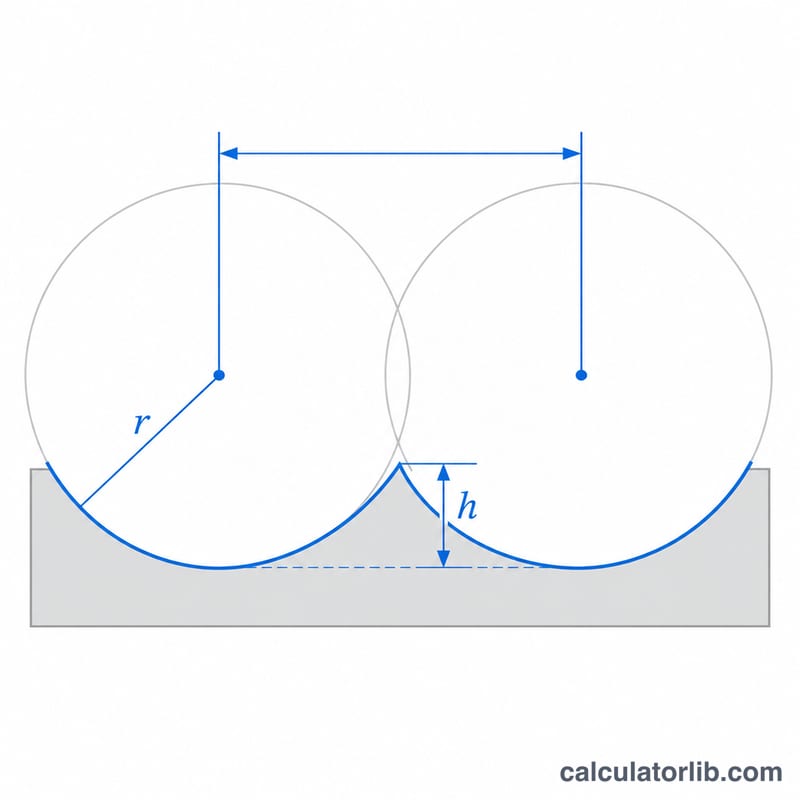
$$R_t = \frac{f_z^2}{8R}, \qquad R_a \approx \frac{R_t}{4}$$where \(f_z\) is feed per tooth and \(R\) is the nose radius. The scallop height from stepover \(a_e\) is:
$$h = R - \sqrt{R^2 - \left(\tfrac{a_e}{2}\right)^2}$$The calculator converts both to Ra by dividing by 4 and uses the larger value. Inverting the formulas gives \(f_{z,max} = \sqrt{32\,R\,R_a}\) for the allowed feed.
Worked example
Ball-end with \(R = 4\) mm, \(f_z = 0.2\) mm, \(a_e = 0.5\) mm:
$$R_t = \frac{0.2^2}{8 \times 4} = 0.00125\,\text{mm} = 1.25\,\mu\text{m}$$$$h = 4 - \sqrt{4^2 - 0.25^2} \approx 0.00782\,\text{mm} = 7.82\,\mu\text{m}$$The scallop gives Ra of about 1.955 µm, which exceeds a 1.6 µm target, so the stepover must be reduced to roughly 0.452 mm.
Typical Ra Values by Machining Process and Finish Grade
The table lists general industry ranges for the arithmetic mean roughness Ra in milling. They are rules of thumb, not guarantees. Real results depend on the machine, tool wear, material, coolant and vibration. Ra is defined in ISO 4287 and, in the newer standard, ISO 21920. The N-grade numbers come from older editions of ISO 1302, which now specifies Ra values directly on drawings.
| Operation | Typical Ra (µm) | Typical Ra (µin) | ISO 1302 grade (legacy N) | Typical application |
|---|---|---|---|---|
| Rough milling | 6.3 – 12.5 | 250 – 500 | N9 – N10 | Stock removal, non-functional surfaces |
| Semi-finish milling | 3.2 – 6.3 | 125 – 250 | N8 – N9 | Pre-finish passes, general machined faces |
| Finish milling | 0.8 – 3.2 | 32 – 125 | N6 – N8 | Mating faces, fixtures, housings, mold bases |
| Fine / ball-end finishing | 0.4 – 0.8 | 16 – 32 | N5 – N6 | 3D contoured surfaces, mold and die cavities, sealing surfaces |
Note: the upper bound of each range is the rougher grade, and adjacent ranges share a boundary value (for example 3.2 µm).
Scenario Comparison: Feed and Stepover vs Ra
Fixed cutter: ball-end with radius R = 4 mm (8 mm diameter). Formulas used:
- Feed-mark Ra: \(\text{Ra}_{feed} = \dfrac{1000\,f_z^2}{32R}\) µm
- Feed-mark peak-to-valley: \(R_t = 4\,\text{Ra}_{feed} = \dfrac{1000\,f_z^2}{8R}\) µm
- Scallop height: \(h = 1000\left(R - \sqrt{R^2 - (a_e/2)^2}\right)\) µm
- Governing Ra: \(\max(\text{Ra}_{feed},\ h/4)\)
Pass/fail is checked against a required Ra of 1.6 µm. The Rt column is the feed-mark value only.
| fz (mm) | ae (mm) | Rt feed (µm) | Scallop h (µm) | Governing Ra (µm) | vs 1.6 µm |
|---|---|---|---|---|---|
| 0.05 | 0.1 | 0.078 | 0.313 | 0.078 | Pass |
| 0.1 | 0.1 | 0.313 | 0.313 | 0.078 | Pass |
| 0.2 | 0.1 | 1.250 | 0.313 | 0.313 (feed) | Pass |
| 0.3 | 0.1 | 2.813 | 0.313 | 0.703 (feed) | Pass |
| 0.05 | 0.25 | 0.078 | 1.954 | 0.488 | Pass |
| 0.1 | 0.25 | 0.313 | 1.954 | 0.488 | Pass |
| 0.2 | 0.25 | 1.250 | 1.954 | 0.488 | Pass |
| 0.3 | 0.25 | 2.813 | 1.954 | 0.703 (feed) | Pass |
| 0.05 | 0.5 | 0.078 | 7.820 | 1.955 | Fail |
| 0.1 | 0.5 | 0.313 | 7.820 | 1.955 | Fail |
| 0.2 | 0.5 | 1.250 | 7.820 | 1.955 | Fail |
| 0.3 | 0.5 | 2.813 | 7.820 | 1.955 | Fail |
| 0.05 | 1.0 | 0.078 | 31.373 | 7.843 | Fail |
| 0.1 | 1.0 | 0.313 | 31.373 | 7.843 | Fail |
| 0.2 | 1.0 | 1.250 | 31.373 | 7.843 | Fail |
| 0.3 | 1.0 | 2.813 | 31.373 | 7.843 | Fail |
What the table shows
- Scallop usually dominates. In 12 of the 16 rows the scallop term h/4 is larger than the feed-mark Ra. Feed only governs when stepover is very small (ae = 0.1 mm) and fz is 0.2 mm or more.
- Ra scales with the square. For small stepover, \(h \approx a_e^2/(8R)\), so doubling ae (0.25 → 0.5 mm) increases h by about 4× (1.954 → 7.820 µm). Likewise \(\text{Ra}_{feed} \propto f_z^2\): doubling fz (0.1 → 0.2 mm) gives 4× the feed-mark Ra (0.078 → 0.313 µm).
- Practical consequence. To reach 1.6 µm with this cutter, reducing stepover to about 0.25 mm or less is far more effective than slowing the feed.
These values are theoretical geometric estimates. They ignore runout, deflection, vibration, built-up edge and tool wear, which usually make real Ra higher.
Ra Conversion: µm, µin and ISO Roughness Grades
The conversion is 1 µm = 39.37 µin (1 µin = 0.0254 µm). The table shows exact conversions and the rounded values customarily printed on drawings. The legacy ISO 1302 N-grades map to the preferred Ra series.
| Ra (µm) | Ra (µin), exact | Ra (µin), customary | ISO 1302 grade (legacy) |
|---|---|---|---|
| 0.2 | 7.9 | 8 | N4 |
| 0.4 | 15.7 | 16 | N5 |
| 0.8 | 31.5 | 32 | N6 |
| 1.6 | 63.0 | 63 | N7 |
| 3.2 | 126.0 | 125 | N8 |
| 6.3 | 248.0 | 250 | N9 |
| 12.5 | 492.1 | 500 | N10 |
Each step in the series roughly doubles Ra. Example: \(1.6\ \text{µm} \times 39.37 = 63.0\ \text{µin}\). The N-grade scheme appears in older editions of ISO 1302. Current drawings normally state the Ra value directly, and Ra itself is defined in ISO 4287 and ISO 21920.
FAQ
Is the result the real measured roughness?
No. It is an ideal geometric value. Real surfaces are rougher because of tool runout, vibration, tool wear and built-up edge.
Why divide Rt by 4?
For a circular-arc profile, Ra is approximately a quarter of the peak-to-valley height, which is a standard approximation.
Does it apply to flat end mills?
Use the corner radius or insert nose radius as R for the feed-mark estimate. The scallop formula applies to ball or bull-nose tools on curved or inclined surfaces.