What this calculator does
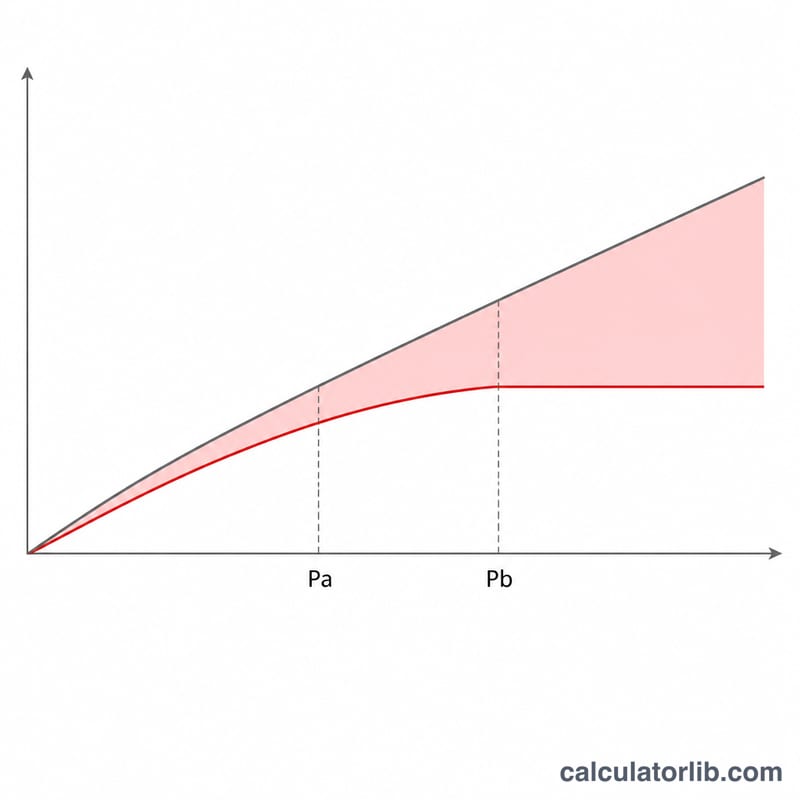
Providing liquidity on Uniswap V3 concentrates your capital inside a chosen price range, which boosts fee income but also amplifies impermanent loss (IL) compared with a full-range V2 position. This tool estimates that loss by comparing the value of your liquidity position after a price move against the value you would have had by simply holding the two tokens.
The formula explained
Impermanent loss is the ratio of position value to hold value, minus one:
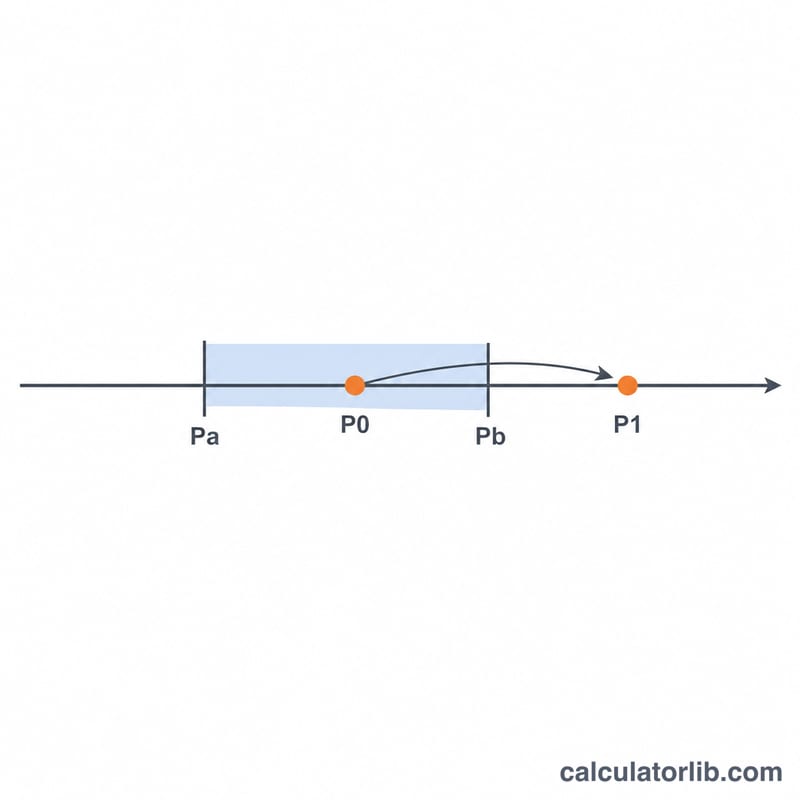
$$\text{IL} = \frac{V_{\text{pos}}}{V_{\text{hold}}} - 1$$While the price \(P\) stays inside the range \([P_a, P_b]\), the value per unit of liquidity is:
$$V = 2\sqrt{P} - \frac{P}{\sqrt{P_b}} - \sqrt{P_a}$$The hold value uses the tokens you deposited at the entry price \(P_0\), where \(x_0 = \frac{1}{\sqrt{P_0}} - \frac{1}{\sqrt{P_b}}\) and \(y_0 = \sqrt{P_0} - \sqrt{P_a}\), valued at the new price:
$$V_{\text{hold}} = x_0 P_1 + y_0$$If \(P_1\) leaves the range, the position converts fully into one token, which increases the loss versus holding.
Worked example
Take entry \(P_0 = 100\), exit \(P_1 = 150\), range \(P_a = 50\) and \(P_b = 200\).
$$V_{\text{pos}} = 2\sqrt{150} - \frac{150}{\sqrt{200}} - \sqrt{50} = 6.817$$$$V_{\text{hold}} = (0.1 - 0.0707)\times 150 + (10 - 7.071) = 7.322$$$$\text{IL} = \frac{6.817}{7.322} - 1 \approx -6.90\%$$So a 50% price rise inside this range costs roughly 6.9% versus holding.
How to use it
Enter your entry price, the current or exit price, and the lower and upper bounds of your liquidity range. A tighter range around the entry price produces a larger impermanent loss for the same price move, but it also earns more fees while the price stays inside it.
Impermanent Loss Across Ranges and Price Moves
The table below starts every position at an entry price of \(P_0 = 100\), quoted as token Y per token X. Each column is a different price range. Each row is a different exit price \(P_1\). Every cell uses the per-unit-liquidity convention: the position value \(V_{pos}\) is compared with simply holding the original deposit, \(V_{hold} = x_0 \cdot P_1 + y_0\). Values show impermanent loss as a percentage of the hold value, with trading fees excluded. The full-range column uses the classic Uniswap V2 result \(\text{IL} = \frac{2\sqrt{r}}{1+r} - 1\) with \(r = P_1/P_0\). This is the limit of the V3 formulas as \(P_a \to 0\) and \(P_b \to \infty\).
| Exit price \(P_1\) | Full range (V2) | Wide 50–200 | Medium 80–125 | Narrow 95–105 |
|---|---|---|---|---|
| 50 | −5.72% | −19.53% (at Pa) | −29.40% * | −33.00% * |
| 80 | −0.62% | −2.11% | −5.87% (at Pa) | −10.17% * |
| 90 | −0.14% | −0.47% | −1.31% | −4.13% * |
| 110 | −0.11% | −0.39% | −1.07% | −3.50% * |
| 125 | −0.62% | −2.11% | −5.87% (at Pb) | −9.79% * |
| 150 | −2.02% | −6.90% | -15.28% * | −18.63% * |
| 200 | −5.72% | −19.53% (at Pb) | −29.40% * | −31.97% * |
* = \(P_1\) is outside \([P_a, P_b]\), so the position holds only one token. "At Pa" / "at Pb" = the price is exactly on the range edge, where the position has just finished converting to a single token.
Narrower ranges lose more for the same move. Take a 10% move up to 110. The loss is −0.11% for full range, −0.39% for 50–200, −1.07% for 80–125 and −3.50% for 95–105. While the price stays inside the range, a concentrated position's loss is the V2 loss scaled by about \(1/\left(1 - (P_a/P_b)^{1/4}\right)\). That factor is about 3.41 for 50–200 and about 9.47 for 80–125. You can see this in the table: −0.62% × 3.41 ≈ −2.11% and −0.62% × 9.47 ≈ −5.87%.
Out of range, the amplification stops. Once the price leaves the range, the position stops rebalancing. It becomes a fixed amount of one token. From that point, extra loss comes only from holding that token instead of the original mix, not from further concentrated selling. The narrow range shows this clearly: it was already about 3.5% behind holding at 110, but between 125 and 200 its loss grows by about the same number of percentage points as the 80–125 range (−9.79% → −31.97% versus −5.87% → −29.40%). The gaps between the ranges also shrink. At 80 the narrow range loses roughly 1.7× as much as the medium range, but at 50 it loses only about 1.1× as much. Wider ranges keep rebalancing longer, so they catch up. The loss does not disappear, though: an out-of-range position still keeps falling behind holding as the price moves further.
Equal ratio moves in either direction give the same loss (for example, 80 and 125 are both a factor of 1.25 from 100). That is why rows such as 80/125 and 50/200 match for every range centred geometrically on 100. The narrow range 95–105 is not exactly geometric around 100, so its rows differ slightly.
How to Calculate V3 Impermanent Loss by Hand
Prices are always quoted as token Y per token X (for example, USDC per ETH). The deposit formulas below only apply when the entry price is inside the range, \(P_a \le P_0 \le P_b\). If you open a position outside the range, it is single-sided from the start and needs different deposit amounts. All amounts are per unit of liquidity \(L\), and \(L\) cancels out of the final ratio.
- Take square roots. Compute \(\sqrt{P_0}\), \(\sqrt{P_a}\), \(\sqrt{P_b}\) and \(\sqrt{P_1}\).
- Find the deposited amounts. $$x_0 = \frac{1}{\sqrt{P_0}} - \frac{1}{\sqrt{P_b}}, \qquad y_0 = \sqrt{P_0} - \sqrt{P_a}$$
- Value the hold strategy at the exit price. $$V_{hold} = x_0 \cdot P_1 + y_0$$
- Value the LP position, choosing the case that matches \(P_1\):
- If \(P_1 \le P_a\), the position is all token X. Here \(x = \frac{1}{\sqrt{P_a}} - \frac{1}{\sqrt{P_b}}\), so \(V_{pos} = x \cdot P_1\).
- If \(P_a < P_1 < P_b\): \(V_{pos} = 2\sqrt{P_1} - \frac{P_1}{\sqrt{P_b}} - \sqrt{P_a}\).
- If \(P_1 \ge P_b\), the position is all token Y: \(V_{pos} = \sqrt{P_b} - \sqrt{P_a}\).
- Compute impermanent loss. $$\text{IL} = \frac{V_{pos}}{V_{hold}} - 1$$ Multiply by 100 to get a percentage. A negative value means the position is worth less than holding, before fees.
Example: entry \(P_0 = 100\), range \(P_a = 50\) to \(P_b = 200\), exit \(P_1 = 125\).
- \(\sqrt{100} = 10\), \(\sqrt{50} \approx 7.071068\), \(\sqrt{200} \approx 14.142136\), \(\sqrt{125} \approx 11.180340\).
- \(x_0 = 0.1 - 0.0707107 = 0.0292893\); \(y_0 = 10 - 7.071068 = 2.928932\).
- \(V_{hold} = 0.0292893 \times 125 + 2.928932 = 3.661165 + 2.928932 = 6.590097\).
- \(P_1 = 125\) is inside the range, so \(V_{pos} = 2(11.180340) - \frac{125}{14.142136} - 7.071068 = 22.360680 - 8.838835 - 7.071068 = 6.450777\).
- \(\text{IL} = \frac{6.450777}{6.590097} - 1 = 0.978859 - 1 \approx -0.02114\), or -2.11%.
For the same 25% move, a full-range (V2) position would lose about 0.62%. The 50–200 range concentrates liquidity, which multiplies that loss by about 3.4. In exchange, it earns proportionally more fees while the price stays in range. This calculation is general information about the AMM mechanics and is not financial advice.
FAQ
Is impermanent loss always negative? The IL figure is zero when the price returns to the entry price and negative for any other move; it only becomes a realized loss when you withdraw.
Why is V3 loss larger than V2? Concentrating liquidity into a narrow band behaves like leverage, so the same price change moves your position value more sharply.
Does this include fees? No. This estimates price-driven impermanent loss only; trading fees earned can offset or exceed it.