What Is Yield to Maturity?
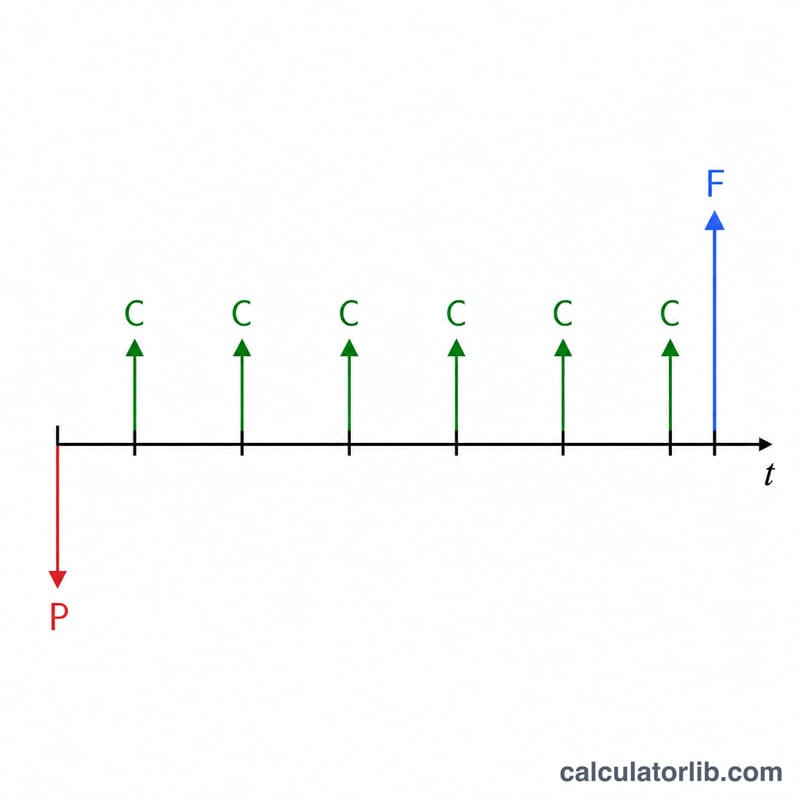
Yield to maturity (YTM) is the total annualized return an investor earns if a bond is bought today and held until it matures, assuming all coupon payments are made on schedule. It accounts for the coupon income, the purchase price, and any gain or loss between the price paid and the face value received at maturity. This calculator uses the widely taught approximate YTM formula, which gives a fast, close estimate without solving the bond-pricing equation iteratively.
How to Use This Calculator
Enter the bond's face value (the amount repaid at maturity, often $1,000), the current price you would pay, the annual coupon rate as a percentage, and the number of years to maturity. The tool computes the annual coupon payment, the current yield, and the approximate yield to maturity instantly.
The Formula Explained
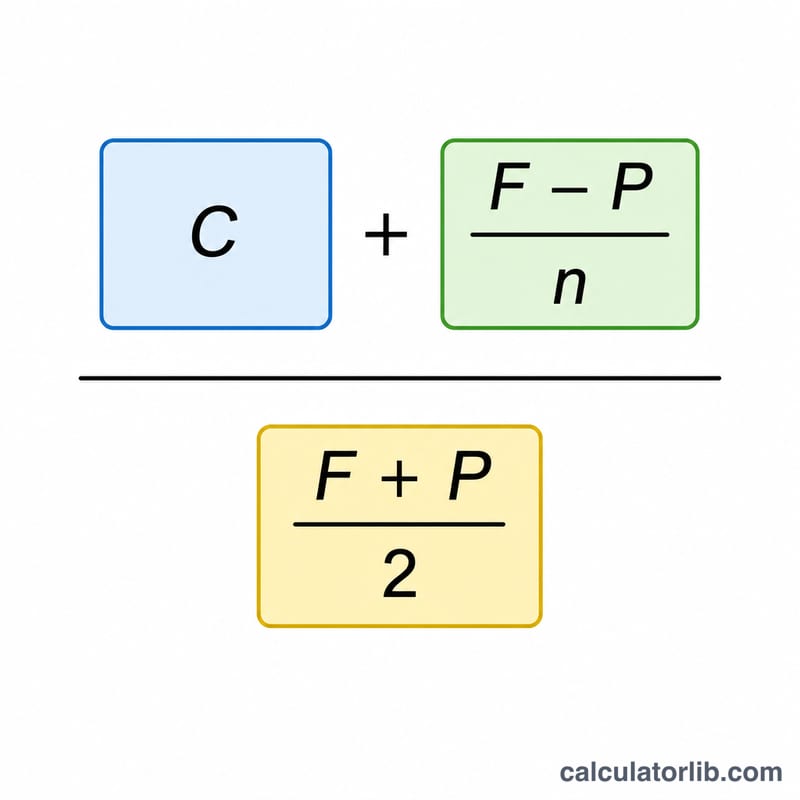
The approximate YTM is:
$$\text{YTM} = \frac{C + \dfrac{F - P}{n}}{\dfrac{F + P}{2}}$$where \(C\) is the annual coupon dollar amount, \(F\) is face value, \(P\) is price, and \(n\) is years. The numerator combines the coupon income with the average annual capital gain or loss. The denominator is the average of price and face value, a proxy for the capital tied up over the bond's life.
Worked Example
Suppose a bond has a $1,000 face value, sells for $920, pays a 6% annual coupon, and matures in 10 years. The annual coupon is $60.
$$\text{YTM} \approx \frac{60 + \dfrac{1000 - 920}{10}}{\dfrac{1000 + 920}{2}} = \frac{60 + 8}{960} = \frac{68}{960} = 0.07083$$or about 7.08%.
Government bond yields today
U.S. Treasury yields by maturity on 2026-11-13 and 10-year government bond yields in the euro area, updated automatically: the market rates that bond prices, mortgages and savings products follow.
- 10-year Treasury
- 5.15%
- 2-year Treasury
- 4.88%
- 3-month Treasury
- 4.32%
- 10-year minus 2-year
- +0.27 pp
| Maturity | Yield | A month earlier (2026-10-13) | Change |
|---|---|---|---|
| 1 mo | 4.10% | 4.10% | 0 bp |
| 3 mo | 4.32% | 4.26% | +6 bp |
| 6 mo | 4.42% | 4.34% | +8 bp |
| 1 yr | 4.65% | 4.48% | +17 bp |
| 2 yr | 4.88% | 4.79% | +9 bp |
| 3 yr | 4.92% | 4.90% | +2 bp |
| 5 yr | 4.98% | 5.00% | −2 bp |
| 7 yr | 5.05% | 5.11% | −6 bp |
| 10 yr | 5.15% | 5.21% | −6 bp |
| 20 yr | 5.52% | 5.60% | −8 bp |
| 30 yr | 5.47% | 5.56% | −9 bp |
Average interest rate the U.S. Treasury pays on its debt, October 2026
The average interest rate on outstanding U.S. Treasury securities by type, published monthly by the Bureau of the Fiscal Service. The total moves slowly: fixed-rate securities already issued keep the rate they were sold at until they mature; bills and floating rate notes follow market rates sooner.
- Marketable debt, October 2026
- 3.570%
- Change in 1 year
- +18 bp
| Security type | Average rate, October 2026 | October 2025 | Change |
|---|---|---|---|
| Treasury bills | 4.014% | 4.075% | −6 bp |
| Treasury notes | 3.399% | 3.124% | +28 bp |
| Treasury bonds | 3.483% | 3.338% | +15 bp |
| Inflation-protected securities (TIPS) | 1.227% | 0.964% | +26 bp |
| Floating rate notes (FRN) | 4.170% | 3.901% | +27 bp |
| Total marketable debt | 3.570% | 3.393% | +18 bp |
| Total interest-bearing debt | 3.580% | 3.355% | +23 bp |
10-year government bond yields in the euro area, 2026-09
Euro area average: 3.93%
| Country | Yield |
|---|---|
| France | 4.44% |
| Italy | 4.36% |
| Greece | 4.22% |
| Malta | 4.19% |
| Slovakia | 4.16% |
| Latvia | 4.15% |
| Belgium | 4.12% |
| Bulgaria | 4.09% |
| Estonia | 4.09% |
| Spain | 3.93% |
| Cyprus | 3.92% |
| Slovenia | 3.86% |
| Portugal | 3.85% |
| Finland | 3.80% |
| Luxembourg | 3.70% |
| Austria | 3.69% |
| Ireland | 3.59% |
| Croatia | 3.59% |
| Netherlands | 3.56% |
| Germany | 3.47% |
| Lithuania | 2.88% |
Latest figure: 2026-11-13 Data last updated 2026-11-13 · current
Source: U.S. Department of the Treasury, Daily Treasury Par Yield Curve Rates Public domain (U.S. government work); European Central Bank, long-term interest rate statistics ECB reuse policy; U.S. Department of the Treasury, Bureau of the Fiscal Service U.S. Government work
The 10-year minus 2-year spread and the changes in basis points (1 bp = 0.01 percentage point) are computed by CalculatorLib from these data.
Source details and methodology
- U.S. Department of the Treasury, Daily Treasury Par Yield Curve Rates
- European Central Bank, long-term interest rate statistics
- U.S. Department of the Treasury, Bureau of the Fiscal Service — Average Interest Rates on U.S. Treasury Securities
Government bond yields: United States: all figures and history
FAQ
How accurate is the approximate formula? It is typically within a few tenths of a percent of the true YTM and is excellent for quick comparisons. The exact YTM requires iterative root-finding.
What is the difference between YTM and current yield? Current yield is just coupon \(\div\) price and ignores any gain or loss at maturity, while YTM includes it.
Why is YTM higher than the coupon rate here? Because the bond trades below face value (at a discount), the investor also gains the price-to-par difference, raising the total return.