
What This Calculator Does
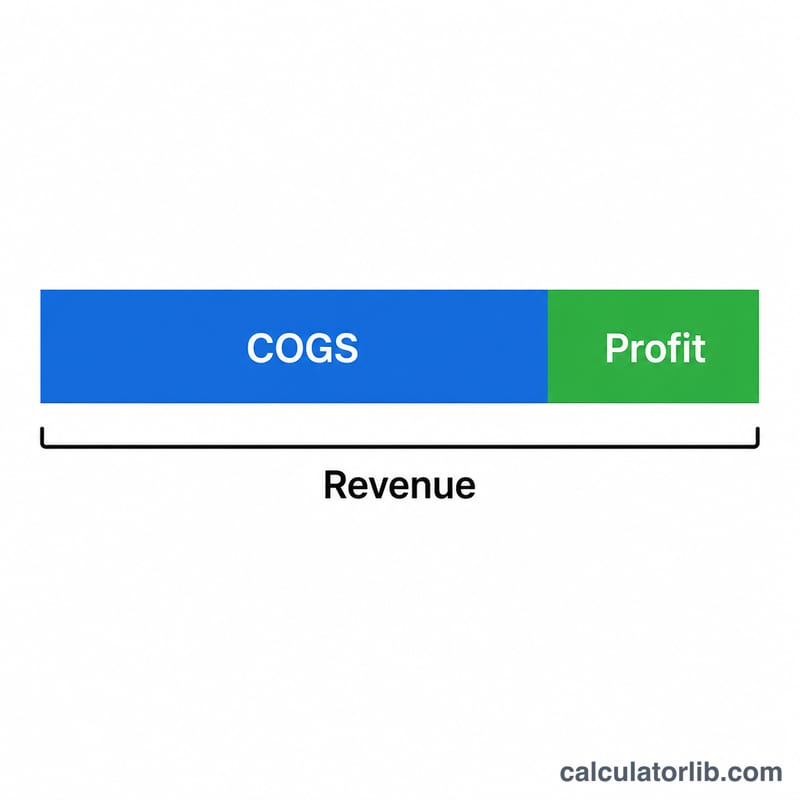
The Gross Profit Margin Calculator measures how much of your sales revenue remains after you subtract the direct costs of producing or buying the goods you sell. It is a quick way to gauge core profitability before operating expenses, taxes and interest are factored in. The tool works with any currency, so it is useful for businesses anywhere in the world — just enter the same currency for both figures.
The Inputs You Provide
- Revenue — the total income from sales over a period (a month, quarter or year).
- Cost of Goods Sold (COGS) — the direct costs tied to producing or purchasing those goods, such as raw materials, manufacturing labour and inventory purchases. It excludes overhead like rent, marketing and salaries of non-production staff.
The Formula Explained
The calculator runs three connected steps:
- Gross Profit = \(\text{Revenue} - \text{Cost of Goods Sold}\)
- Gross Profit Margin (%) = \((\text{Gross Profit} \div \text{Revenue}) \times 100\)
- Gross Margin Ratio = \(\text{Gross Profit} \div \text{Revenue}\) (the same figure expressed as a decimal)
The full formula is:
$$\text{Gross Margin} = \frac{\text{Revenue} - \text{COGS}}{\text{Revenue}} \times 100\%$$The percentage tells you what share of every sales dollar (or euro, pound, etc.) you keep after covering direct production costs.
Worked Example
Suppose your business records Revenue of 50,000 and Cost of Goods Sold of 30,000.
- Gross Profit = \(50{,}000 - 30{,}000 = 20{,}000\)
- Gross Profit Margin = \((20{,}000 \div 50{,}000) \times 100 = 40\%\)
- Gross Margin Ratio = \(20{,}000 \div 50{,}000 = 0.40\)
This means 40% of your revenue is left to cover overheads and generate net profit, while 60% went toward making or buying the products.
Typical Gross Profit Margins by Industry
Gross margin differs widely between sectors because cost structures differ. The ranges below are general approximations only. Actual figures vary by company, business model, region, year and how each company classifies costs as cost of goods sold (COGS) versus operating expenses. Use them as a rough orientation, not as a benchmark or target.
| Sector | Typical gross margin (approximate) | Why |
|---|---|---|
| Software / SaaS | Generally high (often well above 60%) | Low cost to deliver an additional copy or subscription; costs are mostly hosting and support |
| Pharmaceuticals | Generally high (often 60%+) | Patent-protected products; R&D is usually reported outside COGS |
| Professional services | Moderate (often roughly 30%–60%) | Largest cost is staff time, which may or may not be included in COGS |
| Restaurants | Moderate to high if only food and beverage cost is counted; much lower if labor is included | Depends heavily on whether labor is treated as COGS |
| General retail | Moderate (often roughly 20%–50%) | Depends on product mix, brand strength and purchasing power |
| Manufacturing | Low to moderate (often roughly 20%–40%) | Materials, direct labor and factory overhead are in COGS |
| Grocery | Low (often roughly 20%–30%) | High volume, thin pricing, competitive markets |
| Construction | Low (often roughly 10%–25%) | Materials, subcontractors and labor are large; bids are competitive |
| Airlines | Not directly comparable | Most costs (fuel, crews, aircraft) are operating costs, so reported gross margin varies by how they report |
For industry-level datasets, a widely used public source is Aswath Damodaran's industry data at NYU Stern, which publishes gross margin and other averages by industry, mainly for publicly listed companies (US and global versions). Check the most recent edition, as values change from year to year.
Gross Margin Across Different Scenarios
The table keeps revenue fixed at 50,000 (any single currency) and changes COGS, so you can see how cost pressure compresses margin. The last row shows a loss at the gross level. The markup column is included to contrast it with margin.
| Revenue | COGS | Gross Profit | Gross Margin % | Margin Ratio | Markup % (Profit ÷ COGS) |
|---|---|---|---|---|---|
| 50,000 | 20,000 | 30,000 | 60% | 0.60 | 150% |
| 50,000 | 30,000 | 20,000 | 40% | 0.40 | 66.7% |
| 50,000 | 40,000 | 10,000 | 20% | 0.20 | 25% |
| 50,000 | 50,000 | 0 | 0% | 0.00 | 0% |
| 50,000 | 60,000 | -10,000 | -20% | -0.20 | -16.7% |
Example for the second row: \(\frac{50{,}000 - 30{,}000}{50{,}000} \times 100\% = \frac{20{,}000}{50{,}000} \times 100\% = 40\%\). In the last row, COGS exceeds revenue, so gross profit is negative: \(\frac{50{,}000 - 60{,}000}{50{,}000} \times 100\% = -20\%\).
Interpreting Your Gross Margin Result
Gross margin shows what share of each unit of revenue remains after paying the direct costs of producing or buying what was sold:
$$\text{Gross Margin} = \frac{\text{Revenue} - \text{COGS}}{\text{Revenue}} \times 100\%$$
High versus low margin
- Higher margin means more money is left from each sale to cover operating expenses (rent, marketing, administration, salaries not in COGS), interest, taxes and profit. It can reflect strong pricing power, efficient production or a low-cost delivery model.
- Lower margin means less cushion. It is common in high-volume, competitive sectors, where profitability depends on scale and tight cost control. A low margin is not automatically bad if volume is high and operating costs are small.
- Zero or negative margin means direct costs equal or exceed revenue, so the business loses money on the product or service before any overhead.
Gross margin versus markup
The two are often confused. Margin is measured against revenue; markup is measured against cost:
$$\text{Markup} = \frac{\text{Gross Profit}}{\text{COGS}} \times 100\%$$
A 40% gross margin corresponds to a markup of \(\frac{0.40}{1 - 0.40} = 66.7\%\). Markup is always larger than margin for any positive profit, and a 50% markup yields only a 33.3% margin. Mixing them up is a common source of pricing errors.
Trends and peer comparison
A single figure says little by itself. A margin that is falling over several periods can signal rising input costs, discounting or a shift in product mix, while a rising one can reflect better pricing or purchasing. Comparing against companies in the same industry and of similar business model is more meaningful than comparing across industries, since structural margins differ widely (see the table above).
Limitations
- It ignores operating expenses, interest, taxes and one-off items, so it does not show overall profitability.
- What counts as COGS differs by company and industry (for example, whether labor, depreciation or shipping is included), which can make comparisons misleading.
- Inventory accounting methods such as FIFO, LIFO (not permitted under IFRS) or weighted average can change reported COGS, especially when prices are changing.
- Averages across a mixed product range can hide products with very different margins.
This is general educational information, not financial or accounting advice.
Frequently Asked Questions
What is a good gross profit margin? It varies widely by industry. Software and services often exceed 70%, retail may sit around 25–40%, and grocery can be in single digits. Compare your margin against competitors in the same sector rather than a universal benchmark.
What's the difference between gross margin and net margin? Gross margin only subtracts direct production costs (COGS). Net margin goes further, also deducting operating expenses, interest and taxes, giving the bottom-line profitability.
Can the margin be negative? Yes. If your COGS is higher than your revenue, gross profit becomes negative, signalling that you are selling products for less than they cost to produce — a sign you need to raise prices or reduce direct costs.